Categories
Uncategorized

TIL: fosm is still a thing

Update, 2020-09-13: fosm.org seems no longer to exist:

Oh my: fosm.org still exists —

fosm.org: Like OpenStreetMap, but more out of date

fosm shouldn’t really be a thing still. It only exists because some people didn’t like the terms of the licence change. Guided by the principles of maximum free software drama, they forked OSM (it was CC-BY-SA at the time) and created fosm.

Thing is, the licence change was in 2012. Most of the fosm data in my neighbourhood looks untouched since then. It’s a fork that’s, um, forked. I remember meeting someone who was so convinced that OSM was going to fail with the new licence, they were saying stuff like “fosm’s gonna drown you guys!”

In the words of Drive-by abuser: 🛵📢 fosm, yeah? Why not, though, eh? It’s your life, innit?

Categories
Uncategorized

My map from “Experimental Cartography: Mapping Knowledge and Perceptions of Our Worlds”

Family Dynamic Balance – Stewart Russell, 2018-09-19

Map Subtitle

How and where and when a Scottish guy whose family has lived near Glasgow forever found love far away and now moves slowly back & forward along Eglinton Avenue East.
The Gulf Stream? It’s the warm waters of the Mississippi-Missouri warming the west coast of Scotland …

Not shown/drawn due to lack of time: the flotilla of water biscuits transporting gullible folks up the River Clyde …

Event Description

In a world of filter bubbles and fake news the importance of understanding how we know what we know and where our information/knowledge comes from is greater than ever. We can use mapping to help us understand these invisible structures that control parts of lives and reveal the ways our perceptions are shaped.

In this hands-on mapping workshop we will create maps of personal knowledge (e.g. personal itineraries, common perceptions, fears, etc.). We will ask: how do I map my perception of the world (e.g. through news media or walking)? Participants will apprehend “their state of our knowledge of the world” on a particular subject as well as create representations which bridge the real and the imaginary.

Philippe Rekacewicz is a cartographer and information designer. After completing his training as a geographer at the University Paris 1 Panthéon-Sorbonne, he worked from 1988 to 2014 as a permanent staff for the monthly journal Le Monde Diplomatique. He concurrently directed, from 1996 to 2008, the Norwegian cartographic unity of the United Nations Programme for Environment (UNEP), the GRID-Arendal. A specialist in Geopolitics and International Relations, he addresses especially topics linked to migrations, refugees and populations’ forced displacements, as well as frontiers. He works at present on several socio-cartographic projects (public and private spaces, perception and representation of frontiers) and explores the links between cartography, art and politics, like the art’s contributions on maps’ production and the political uses of maps as objects ofpropaganda and manipulation. He also leads a research on the “new cartographic writings” and the emergency of radical, critical and experimental cartographies. Since 2006, he attends project of artistic mappings and political art in several European countries. He is associate researcher at the departement of Anthropology of the University of Helsinki (programme Crosslocation – Trade, Transit and Transport). He is the current editor of the research blog on mapping and visualizing Visionscarto http://visionscarto.net/

Experimental Cartography: Mapping Knowledge and Perceptions of Our Worlds was hosted by the public visualization lab at OCAD U in the evening of 2018-09-19.

Categories
Uncategorized

BBC gets all azimuthal equidistant, 1936


Source: National Library of Australia — “With the greetings of the BBC. Christmas 1936” Promotional christmas card with schematic world map produced by the British Broadcasting Corporation.

(indirectly via Rupert Goodwins.)

Categories
Uncategorized

map markers: don’t have to stick to the defaults

Some of the languages of Irian Jaya

Map background: Natural Earth (public domain)
Language point data: Glottolog (licence: Creative Commons — Attribution-ShareAlike 3.0 Unported — CC BY-SA 3.0)
Map markers: font: Overpass (licence: SIL OFL/LGPL), character: 💬 — U+1F4AC SPEECH BALLOON.
Label font: U001Con Italic (foundry: URW++, licence: AFPL)

Categories
GIS

Ghost tracks make a city

My GPS tracks in Toronto, 2007–present

Generated using ptrv/gpx2spatialite, rendered in QGIS as lines with 75% transparency.

Categories
GIS

Ontario Microwave Links

See full screen

Visualizing where the data flows without wires. Extracted from the Ontario Technical and Administrative Frequency List (TAFL), and used under the Open Government Licence – Canada.

Categories
GIS

uMap, i map, we all map

uMap is neat. It allows you to trace places, routes and areas on top of OpenStreetMap tiles, and then publish/share the results.

(here’s a full screen link to my work of cartographic genius.)

Categories
GIS

Not really getting the Azimuthal Equidistant projection right

Update: thanks to André, this works! See the updated ogr2ogr line.

All I really wanted to do is make a map like this:

This is an Azimuthal Equidistant projection, with me at the centre (of course) and the rest of the world spread out in a fan by distance and bearing. It’s somewhat surprising to find that South Africa is almost directly east of Toronto, and New Zealand to the southwest.

If I had a directional antenna and a rotor, this map would show me where I would have to point the antenna to contact that part of the world. I can’t rotate my dipole (unless I commit some unauthorized local plate tectonics) so I’m stuck with where my antenna transmits and receives best.

The above map was made with AZ_PROJ, a PostScript program of some complexity for plotting world maps for radio use. The instructions for installing and running AZ_PROJ are complex and slightly dated. I got the above output running it through Ghostscript like this:

gs -sDEVICE=pdfwrite -sOutputFile=va3pid_world.pdf az_ini.ps -- az_proj.ps world.wdb

The format of the az_ini.ps file is complex, and I’m glad I’m an old PS hacker to be able to make head or tail of it.

For all its user-hostility, AZ_PROJ is powerful. Here’s a version of the map I wanted all along:

This shows my furthest QSO in each of the 16 compass directions. (You might note that North is empty: my furthest contact in that direction is some 13km away, whether by lack of folks in that sector or dodginess of my antenna.) Contrast that with my Mercator QSO map, and you’ll see that Azimuthal Equidistant is a much better projection for this application.

To show how radically different the world looks to different people, here’s the world according to my mate Rob in Hamilton, NZ:

I’d been trying to use OGR to transform arbitrary shapefiles into this projection. For maps entirely contained within the same hemisphere (so having extent less than ±90° in any cardinal direction), this works:

ogr2ogr -t_srs "+proj=aeqd  +lat_0=43.7308 +lon_0=-79.2647" out.shp in.shp

The lat_0 and lon_0 parameters are just where you want the centre of the map to be. Things get a bit odd if you try to plot the whole world:

The antipodes get plotted underneath, and everything looks messed up. I may have to take my question to GIS – Stack Exchange to see if I can find an answer. Still, for all its wrongness, you can make something pretty, like my whole world Maidenhead locator grid projected this way turns into a rose:

Update: André advised on Stack Exchange that you need to specify the correct radius:

ogr2ogr -t_srs "+proj=aeqd  +lat_0=43.7308 +lon_0=-79.2647 +R=6371000" va3pid-world.shp TM_WORLD_BORDERS_SIMPL-0.3.shp

This works rather well:

aeqd-qgis


Categories
Uncategorized

#mapfail

… or “トロント動物園“, as we locals purportedly call it. The This place has unverified edits legend is a bit of a giveaway. Looks like there’s been some messing about with Google Map Maker, which isn’t always the best tool for the job.

Categories
GIS

Ham Radio log to interactive OpenStreetMap

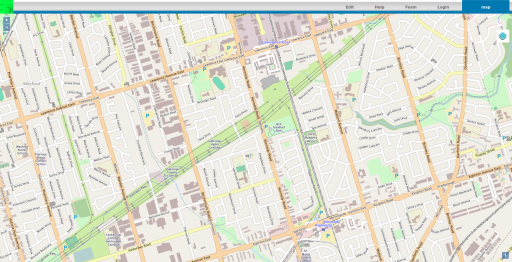
You might notice that there’s now a Ham Radio QSO Map lurking on the front page. Thanks to the WordPress OpenStreetMap plugin (which I’ve slightly abused before). Here’s a small piece of Perl which will take your ADIF log and convert it to a WP-OSM marker file.

Note that this program assumes you’ve downloaded your log from QRZ.com, as it requires the locator field for both inbound and outbound stations.

#!/usr/bin/perl -w
# adif2osm - convert ADIF log to OSM map file
# scruss.com / VA3PID - 2011/06/19

use strict;
use constant MARKERDIR =>
  'https://glaikit.org/wp-content/plugins/osm/icons/';
use constant QRZURL => 'http://qrz.com/db/';
sub maidenhead2latlong;

my ( $temp, @results ) = '';

### Fast forward past header
while (<>) {
  last if m/<eoh>\s+$/i;
}

### While there are records remaining...
while (<>) {
  $temp .= $_;

  ### Process if end of record tag reached
  if (m/<eor>\s+$/i) {
    my %hash;
    $temp =~ s/\n//g;
    $temp =~ s/<eoh>.*//i;
    $temp =~ s/<eor>.*//i;
    my @arr = split( '<', $temp );
    foreach (@arr) {
      next if (/^$/);
      my ( $key, $val ) = split( '>', $_ );
      $key =~ s/:.*$//;
      $hash{ lc($key) } = $val unless ( $key eq '' );
    }
    push @results, \%hash;
    $temp = '';
  }
}

# generate OSM plugin file
my @data = ();
my ( $mygrid, $station_callsign ) = '';

# output header
print
  join( "\t", qw/lat lon title description icon iconSize iconOffset/ ),
  "\n";
foreach (@results) {
  next unless ( exists( $_->{gridsquare} ) && exists( $_->{call} ) );
  $mygrid = $_->{my_gridsquare}
    if ( exists( $_->{my_gridsquare} ) );
  $station_callsign = $_->{station_callsign}
    if ( exists( $_->{station_callsign} ) );

  push @data, $_->{freq} . ' MHz' if ( exists( $_->{freq} ) );
  $data[$#data] .= ' (' . $_->{band} . ')' if ( exists( $_->{band} ) );
  push @data, $_->{mode} if ( exists( $_->{mode} ) );
  push @data, $_->{qso_date} . ' ' . $_->{time_on} . 'Z'
    if ( exists( $_->{qso_date} ) && exists( $_->{time_on} ) );
  my ( $lat, $long ) = maidenhead2latlong( $_->{gridsquare} );
  print join( "\t",
    $lat,
    $long,
    '<a href="' . QRZURL . $_->{call} . '">' . $_->{call} . '</a>',
    join( ' - ', @data ),
    MARKERDIR . 'wpttemp-green.png',
    '0,-24' ),
    "\n";

  @data = ();
}

# show home station last, so it's on top
my ( $lat, $long ) = maidenhead2latlong($mygrid);
print join( "\t",
  $lat,
  $long,
  '<a href="'
    . QRZURL
    . $station_callsign . '">'
    . $station_callsign . '</a>',
  'Home Station',
  MARKERDIR . 'wpttemp-red.png',
  '0,-24' ),
  "\n";

exit;

sub maidenhead2latlong {

  # convert a Maidenhead Grid location (eg FN03ir)
  #  to decimal degrees
  # this code could be cleaner/shorter/clearer
  my @locator =
    split( //, uc(shift) );    # convert arg to upper case array
  my $lat      = 0;
  my $long     = 0;
  my $latdiv   = 0;
  my $longdiv  = 0;
  my @divisors = ( 72000, 36000, 7200, 3600, 300, 150 )
    ;                          # long,lat field size in seconds
  my $max = ( $#locator > $#divisors ) ? $#divisors : $#locator;

  for ( my $i = 0 ; $i <= $max ; $i++ ) {
    if ( int( $i / 2 ) % 2 ) {    # numeric
      if ( $i % 2 ) {             # lat
        $latdiv = $divisors[$i];    # save for later
        $lat += $locator[$i] * $latdiv;
      }
      else {                        # long
        $longdiv = $divisors[$i];
        $long += $locator[$i] * $longdiv;
      }
    }
    else {                          # alpha
      my $val = ord( $locator[$i] ) - ord('A');
      if ( $i % 2 ) {               # lat
        $latdiv = $divisors[$i];    # save for later
        $lat += $val * $latdiv;
      }
      else {                        # long
        $longdiv = $divisors[$i];
        $long += $val * $longdiv;
      }
    }
  }
  $lat  += ( $latdiv / 2 );         # location of centre of square
  $long += ( $longdiv / 2 );
  return ( ( $lat / 3600 ) - 90, ( $long / 3600 ) - 180 );
}

You’ll need to update MARKERDIR to reflect your own WP-OSM installation. Mine might move, so if you don’t change it, and you don’t get markers, please don’t blame me.

The basic code to include a map is like this:

You’ll need to change the marker_file URL, too.

Note that, while this script generates links into the QRZ callsign database, it doesn’t hit that site unless you click a link.
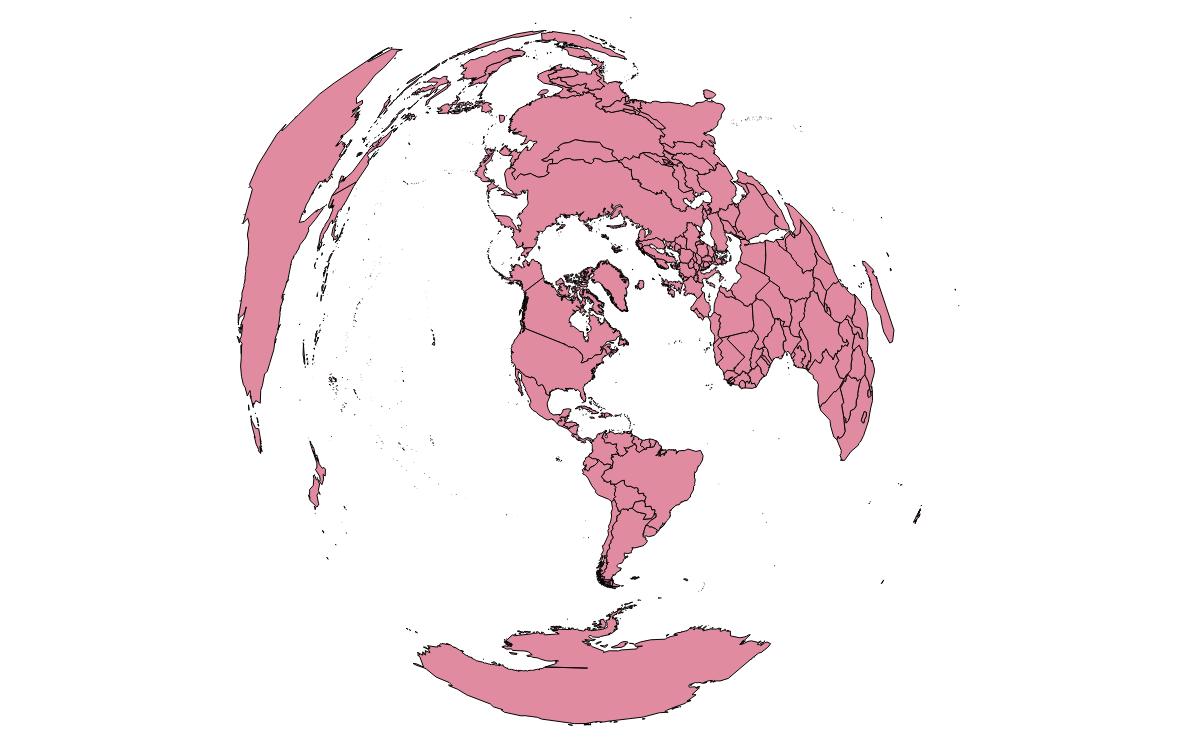