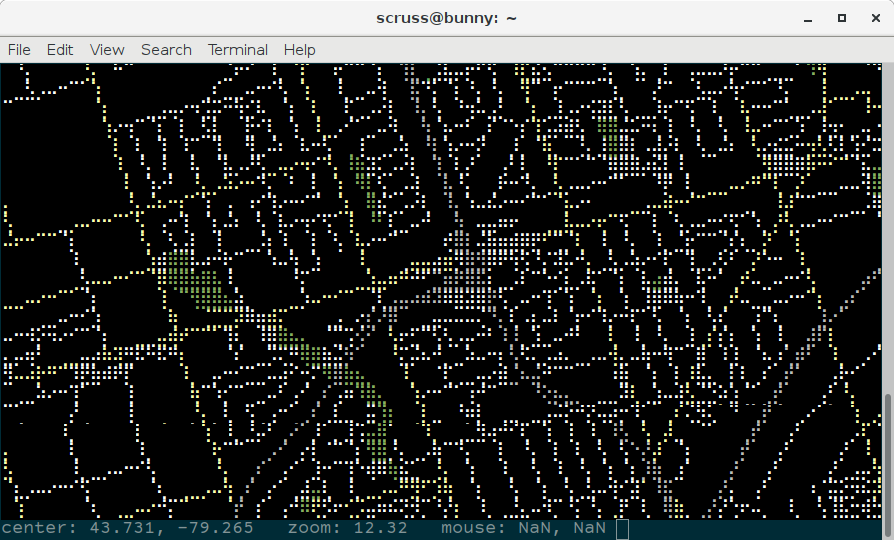
fosm.org: Like OpenStreetMap, but more out of date
fosm shouldn’t really be a thing still. It only exists because some people didn’t like the terms of the licence change. Guided by the principles of maximum free software drama, they forked OSM (it was CC-BY-SA at the time) and created fosm.
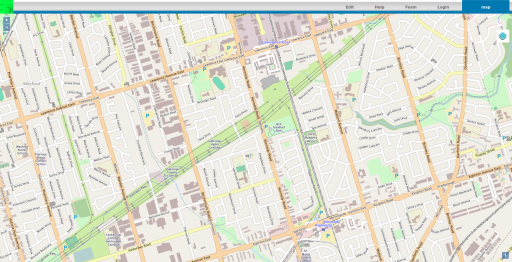
Thing is, the licence change was in 2012. Most of the fosm data in my neighbourhood looks untouched since then. It’s a fork that’s, um, forked. I remember meeting someone who was so convinced that OSM was going to fail with the new licence, they were saying stuff like “fosm’s gonna drown you guys!”
In the words of Drive-by abuser: 🛵📢 fosm, yeah? Why not, though, eh? It’s your life, innit?
Looks like hell has frozen over — there’s now an Ontario open buildings layer that’s compatible with the OSM licence: The Open Database of Buildings. Thanks go to StatCan for aggregating all the data sets into one huge database.
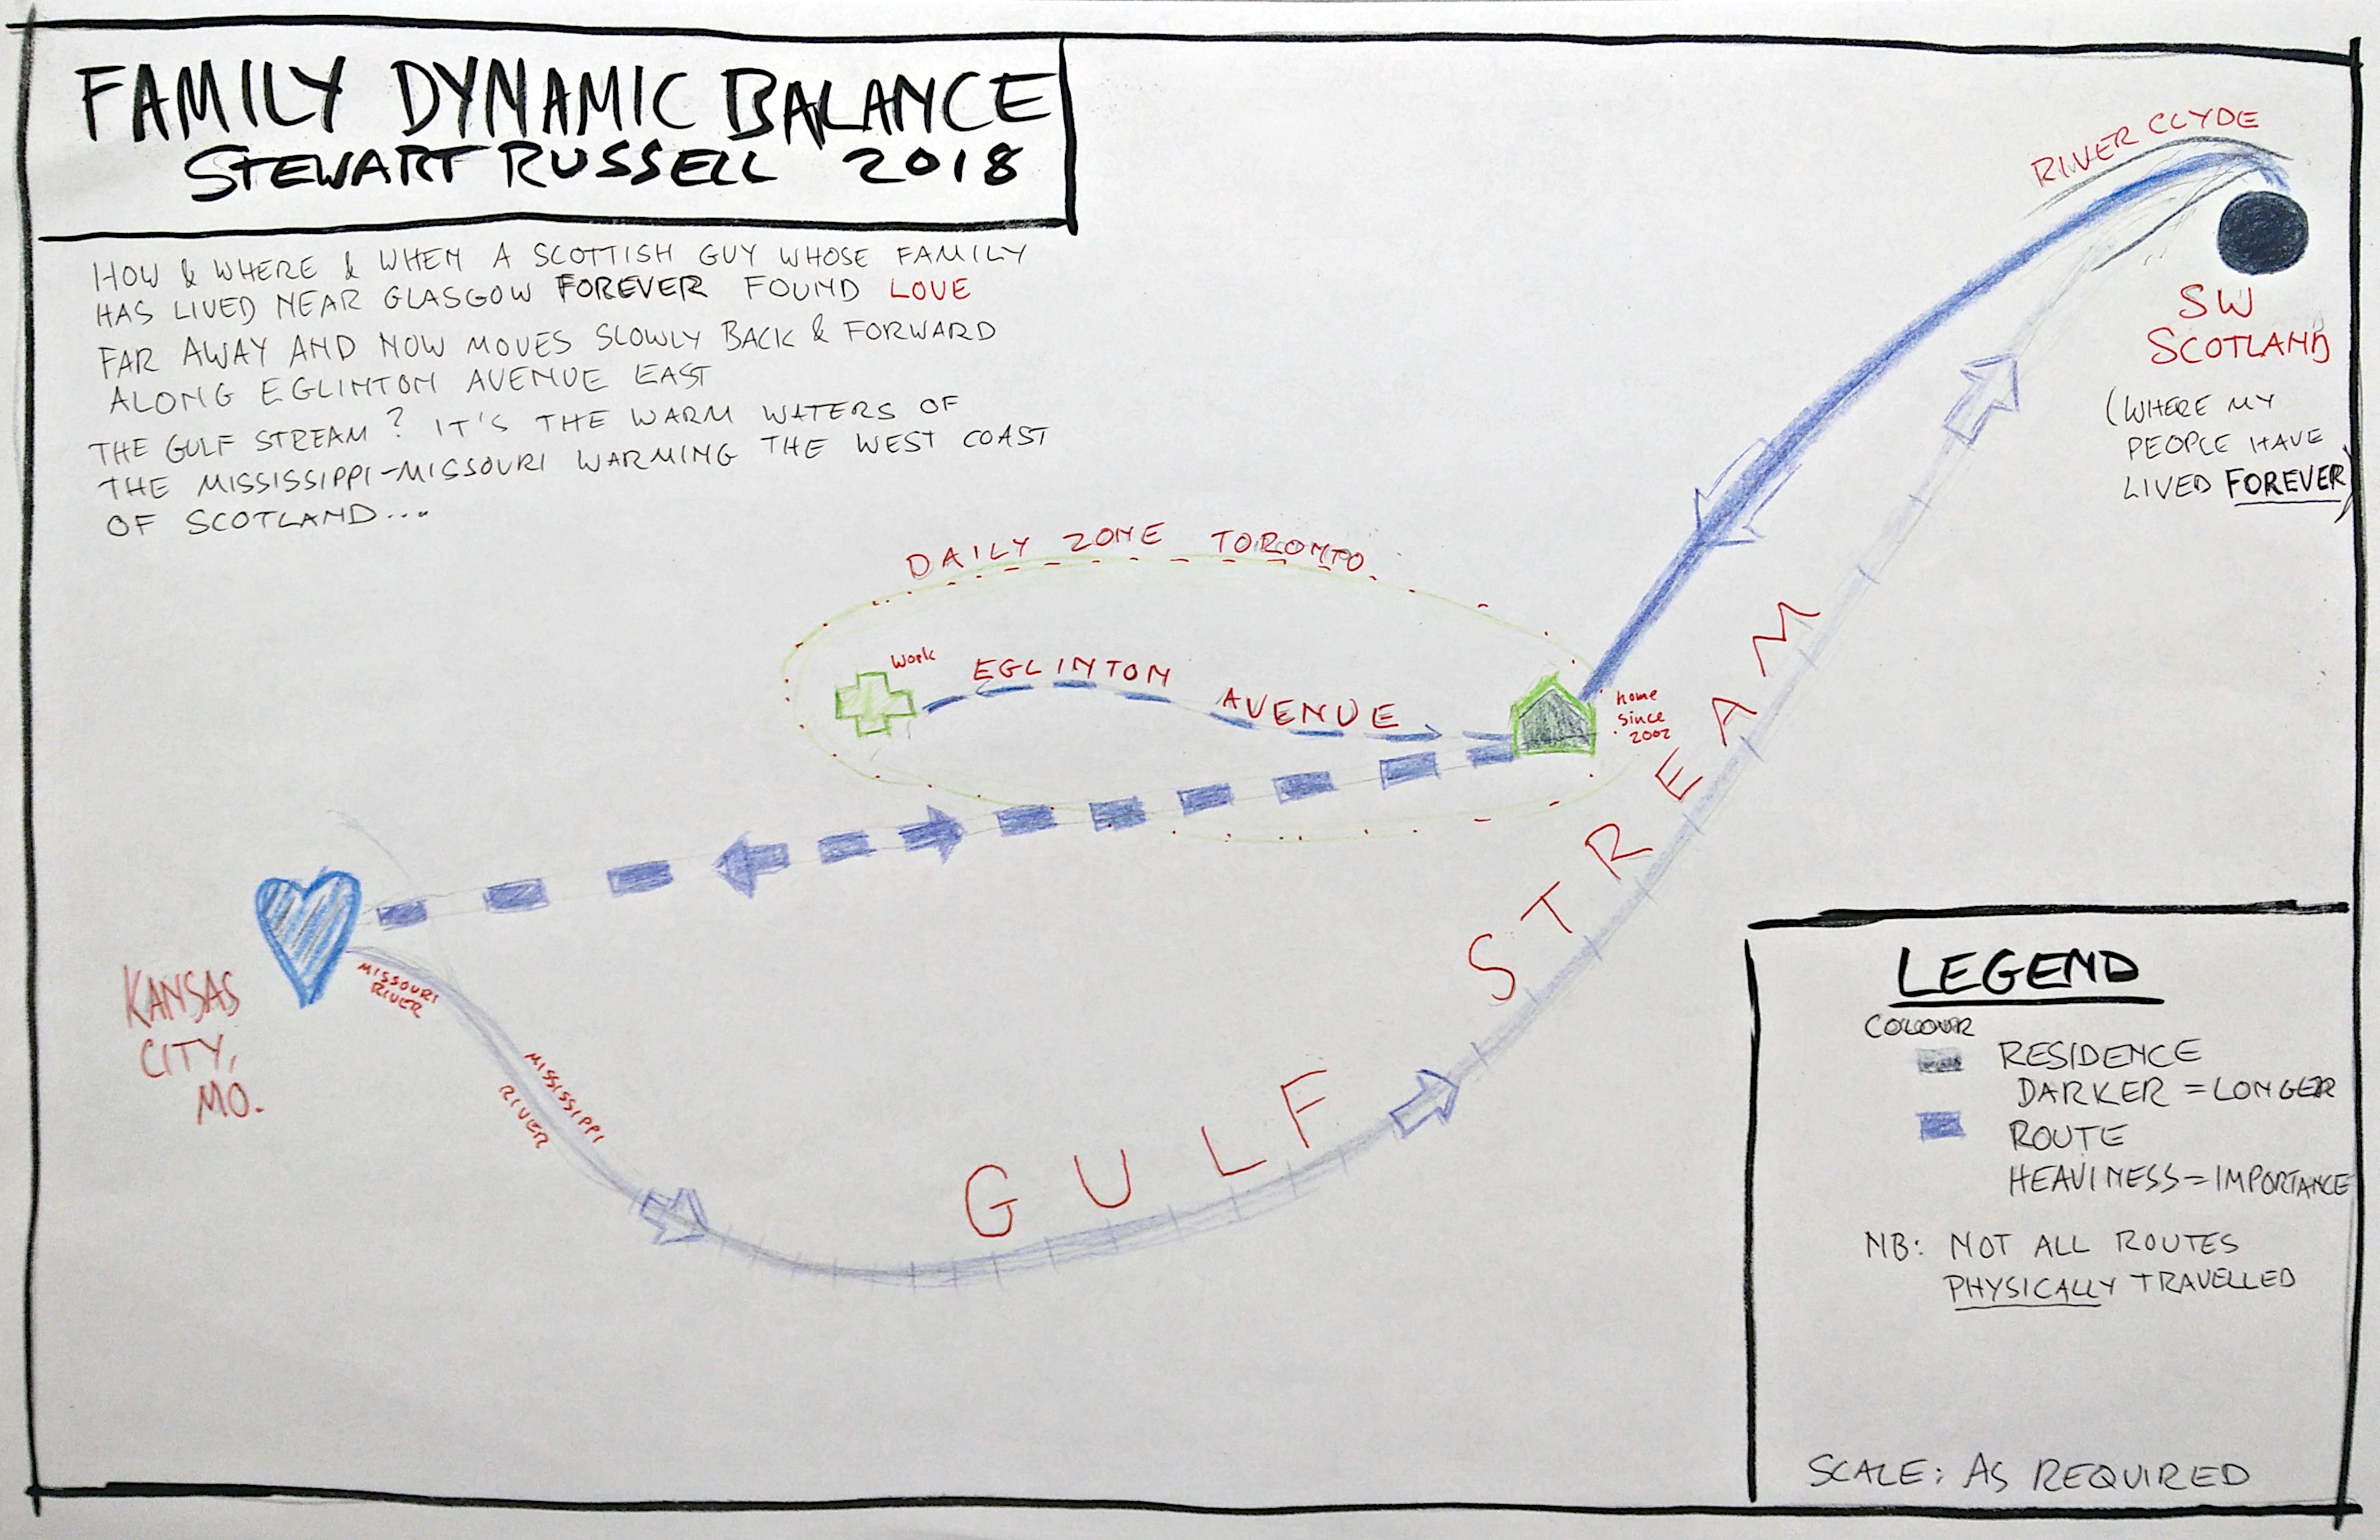
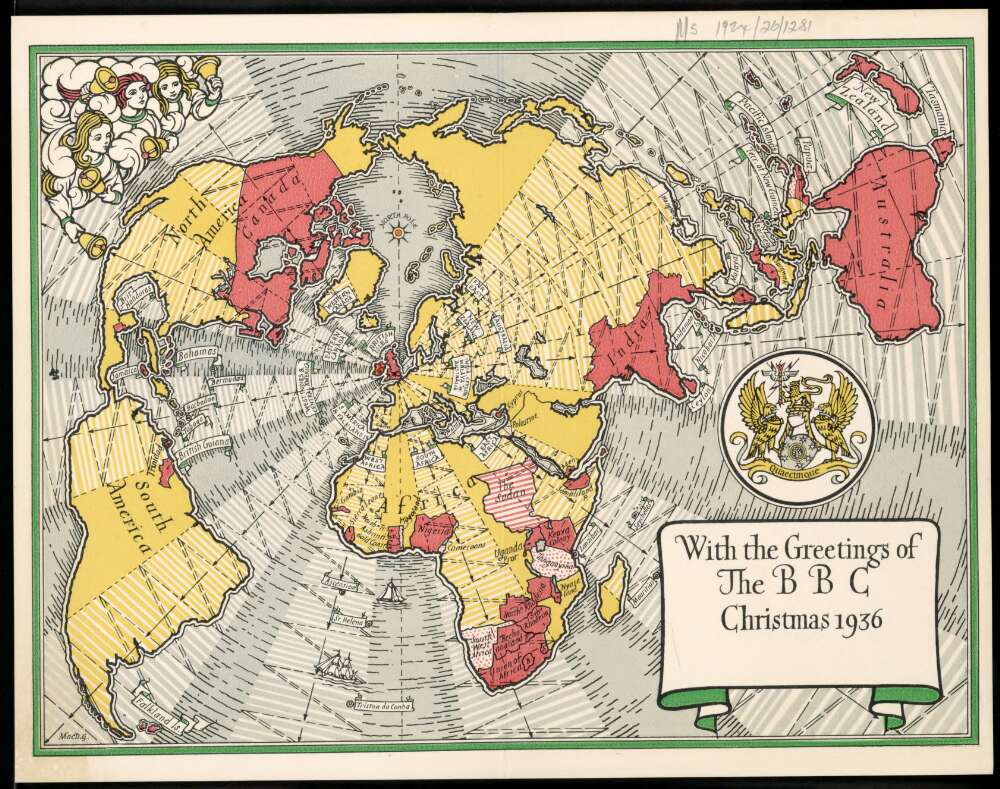
Family Dynamic Balance – Stewart Russell, 2018-09-19
Map Subtitle
How and where and when a Scottish guy whose family has lived near Glasgowforever found love far away and now moves slowly back & forward along Eglinton Avenue East.
The Gulf Stream? It’s the warm waters of the Mississippi-Missouri warming the west coast of Scotland …
Not shown/drawn due to lack of time: the flotilla of water biscuits transporting gullible folks up the River Clyde …
Event Description
In a world of filter bubbles and fake news the importance of understanding how we know what we know and where our information/knowledge comes from is greater than ever. We can use mapping to help us understand these invisible structures that control parts of lives and reveal the ways our perceptions are shaped.
In this hands-on mapping workshop we will create maps of personal knowledge (e.g. personal itineraries, common perceptions, fears, etc.). We will ask: how do I map my perception of the world (e.g. through news media or walking)? Participants will apprehend “their state of our knowledge of the world” on a particular subject as well as create representations which bridge the real and the imaginary.
Philippe Rekacewicz is a cartographer and information designer. After completing his training as a geographer at the University Paris 1 Panthéon-Sorbonne, he worked from 1988 to 2014 as a permanent staff for the monthly journal Le Monde Diplomatique. He concurrently directed, from 1996 to 2008, the Norwegian cartographic unity of the United Nations Programme for Environment (UNEP), the GRID-Arendal. A specialist in Geopolitics and International Relations, he addresses especially topics linked to migrations, refugees and populations’ forced displacements, as well as frontiers. He works at present on several socio-cartographic projects (public and private spaces, perception and representation of frontiers) and explores the links between cartography, art and politics, like the art’s contributions on maps’ production and the political uses of maps as objects ofpropaganda and manipulation. He also leads a research on the “new cartographic writings” and the emergency of radical, critical and experimental cartographies. Since 2006, he attends project of artistic mappings and political art in several European countries. He is associate researcher at the departement of Anthropology of the University of Helsinki (programme Crosslocation – Trade, Transit and Transport). He is the current editor of the research blog on mapping and visualizing Visionscarto http://visionscarto.net/
Experimental Cartography: Mapping Knowledge and Perceptions of Our Worlds was hosted by the public visualization lab at OCAD U in the evening of 2018-09-19.
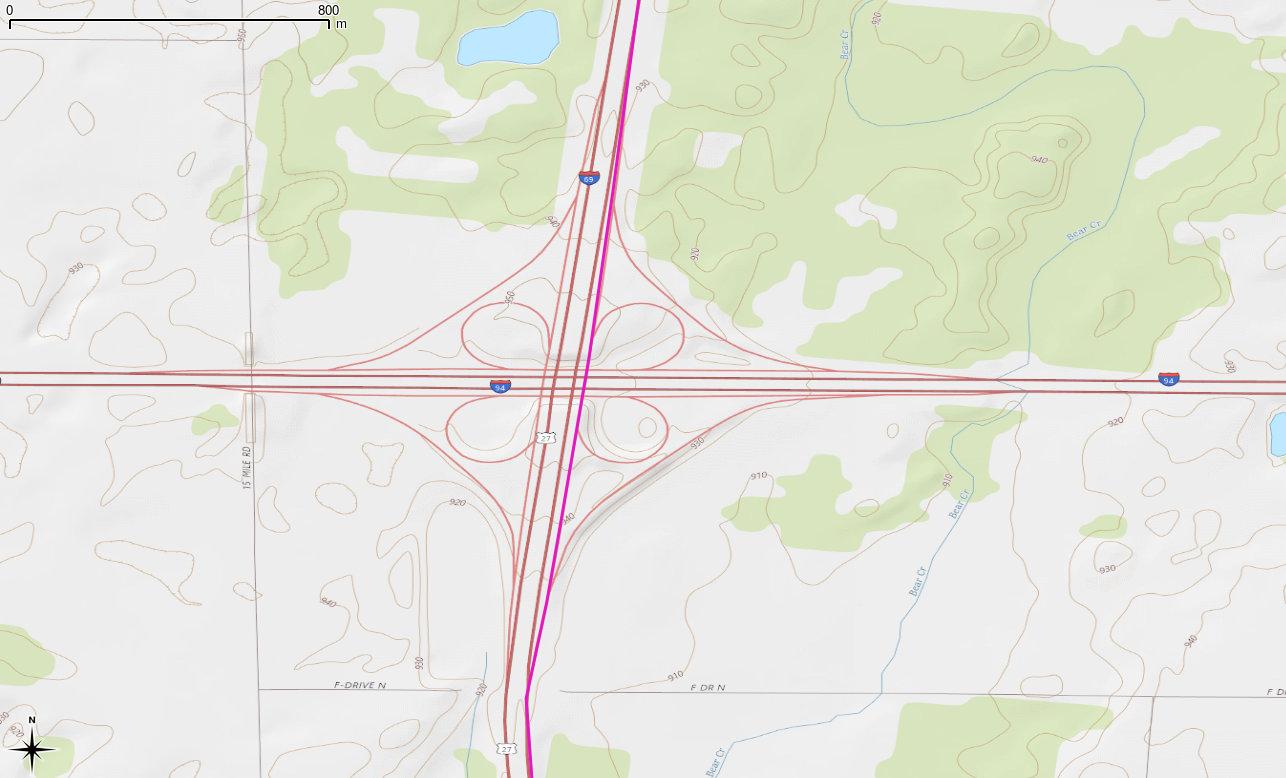
Garmin preferred route via I 69 slip-road at I 94 junction
Well, that was fun … because the slip-road at the I 69/I 94 junction in central Michigan is a slightly shorter route than continuing on the I 69, The Algorithm (which cannot be Questioned) routed me off the I 69 then back on again.
These self-driving cars, I dunno … least useful innovation ever.
Took me nine minutes to legally cross Warden Avenue. I had to walk roughly 400 m to get to a crossing, then 400 m back down the street. Straight-line distance between the bus stop and my destination is about 40 m.