Categories
GIS

geocoder.ca’s excellent database

Update, late 2017: Looks like geocoder.ca’s database hasn’t been updated since late 2015. The download link is still active, though.

geocoder.ca provides a crowdsourced postal code geocoder under the ODbL. You can download the database as CSV directly. Here’s a bash script to convert that text file into a (very large) point shapefile:

#!/bin/bash
# geocoder2shp.sh - convert geocoder.ca CSV to a shape file
# NB: input CSV is UTF-8; it is passed through unchanged
# Needs >= v1.7 of GDAL
# scruss - 2012/04/15

if [ ! -f Canada.csv.gz ]
then
    echo ""
    echo " " Download \"Canada.csv.gz\" into the current directory from
    echo "  " http://geocoder.ca/onetimedownload/Canada.csv.gz
    echo " " and try again.
    echo ""
    exit 1
fi

# make input file with header
echo PostalCode,Latitude,Longitude,City,Province > Canada2.csv
gunzip -c Canada.csv.gz >> Canada2.csv

# create GDAL VRT file
cat > Canada2.vrt <<EOF
<OGRVRTDataSource>
  <!-- note that OGRVRTLayer name must be basename of source file -->
  <OGRVRTLayer name="Canada2">
    <SrcDataSource>Canada2.csv</SrcDataSource>
    <GeometryType>wkbPoint</GeometryType>
    <LayerSRS>EPSG:4326</LayerSRS>
    <GeometryField encoding="PointFromColumns" x="Longitude" y="Latitude"/>
    <Field name="PostalCode" type="String" width="6" />
    <Field name="Latitude" type="Real" />
    <Field name="Longitude" type="Real" />
    <Field name="City" type="String" width="60" />
    <Field name="Province" type="String" width="2" />
  </OGRVRTLayer>
</OGRVRTDataSource>
EOF

# create shapefile
ogr2ogr PostalCodes.shp Canada2.vrt

# clean up
rm -f Canada2.csv	Canada2.vrt

Though the script is a bit Unix-centric, it’s just a simple list of instructions which could be run on any command line. What it does is add some headers to the geocoder.ca file, then sets up an OGR Virtual Format to convert the text into a fairly well-defined shapefile. When you use this shapefile, you should credit geocoder.ca as the ODbL requires.

Eek! geocoder.ca has been sued by Canada Post! (News responses: Michael Geist, Boing Boing, CBC) I’ve donated to defend this useful service.
Categories
GIS

Not really getting the Azimuthal Equidistant projection right

Update: thanks to André, this works! See the updated ogr2ogr line.

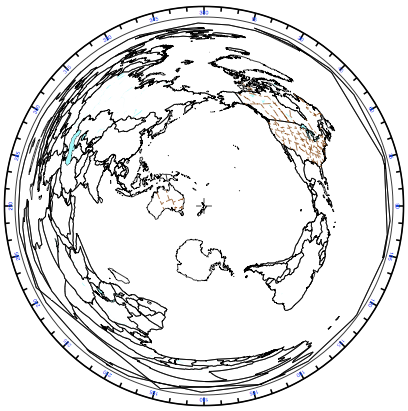
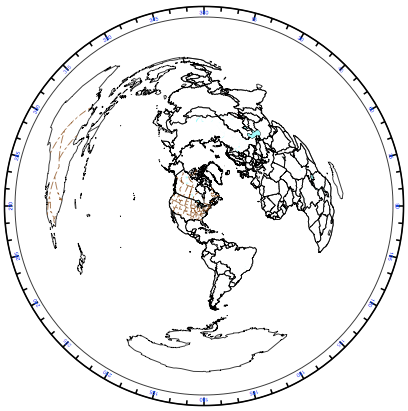
All I really wanted to do is make a map like this:

This is an Azimuthal Equidistant projection, with me at the centre (of course) and the rest of the world spread out in a fan by distance and bearing. It’s somewhat surprising to find that South Africa is almost directly east of Toronto, and New Zealand to the southwest.

If I had a directional antenna and a rotor, this map would show me where I would have to point the antenna to contact that part of the world. I can’t rotate my dipole (unless I commit some unauthorized local plate tectonics) so I’m stuck with where my antenna transmits and receives best.

The above map was made with AZ_PROJ, a PostScript program of some complexity for plotting world maps for radio use. The instructions for installing and running AZ_PROJ are complex and slightly dated. I got the above output running it through Ghostscript like this:

gs -sDEVICE=pdfwrite -sOutputFile=va3pid_world.pdf az_ini.ps -- az_proj.ps world.wdb

The format of the az_ini.ps file is complex, and I’m glad I’m an old PS hacker to be able to make head or tail of it.

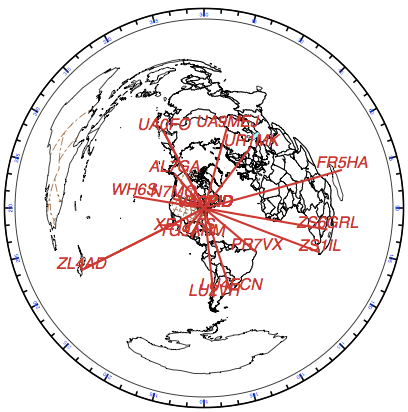
For all its user-hostility, AZ_PROJ is powerful. Here’s a version of the map I wanted all along:

This shows my furthest QSO in each of the 16 compass directions. (You might note that North is empty: my furthest contact in that direction is some 13km away, whether by lack of folks in that sector or dodginess of my antenna.) Contrast that with my Mercator QSO map, and you’ll see that Azimuthal Equidistant is a much better projection for this application.

To show how radically different the world looks to different people, here’s the world according to my mate Rob in Hamilton, NZ:

I’d been trying to use OGR to transform arbitrary shapefiles into this projection. For maps entirely contained within the same hemisphere (so having extent less than ±90° in any cardinal direction), this works:

ogr2ogr -t_srs "+proj=aeqd  +lat_0=43.7308 +lon_0=-79.2647" out.shp in.shp

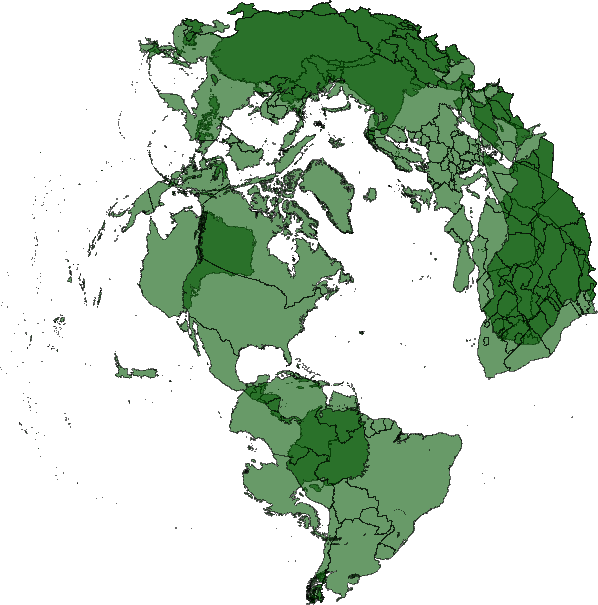
The lat_0 and lon_0 parameters are just where you want the centre of the map to be. Things get a bit odd if you try to plot the whole world:

The antipodes get plotted underneath, and everything looks messed up. I may have to take my question to GIS – Stack Exchange to see if I can find an answer. Still, for all its wrongness, you can make something pretty, like my whole world Maidenhead locator grid projected this way turns into a rose:
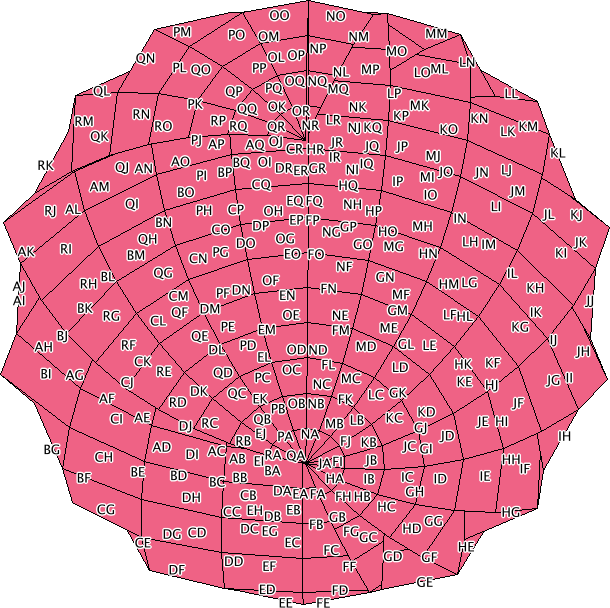
Update: André advised on Stack Exchange that you need to specify the correct radius:

ogr2ogr -t_srs "+proj=aeqd  +lat_0=43.7308 +lon_0=-79.2647 +R=6371000" va3pid-world.shp TM_WORLD_BORDERS_SIMPL-0.3.shp

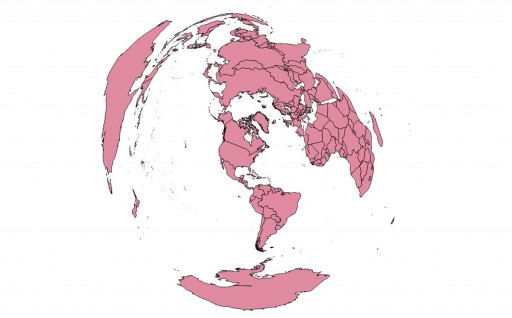
This works rather well:

aeqd-qgis


Categories
Uncategorized

current tools of my trade

Mark asked: What kind of GIS software are you using?
Well, since you asked:-

  • SpatiaLite: spatial awesome built on SQLite. I love it because I don’t need to play DBA.
  • QGIS: for maps
  • ogr: for file format futzing
  • proj: for scrupulously correct (well, if I knew what I was doing …) conversion between projected and otherwise.
  • OpenOffice: for those tedious calculations
  • … and about 20 years of unix experience to mash all the results together.

All of the above are free. I’m doing this because I want to learn. Asking elsewhere hasn’t turned up anything useful.

Categories
GIS

using CSV as a virtual data source

While we already know how to make trivial shapefiles with shapelib, sometimes that’s too tedious. Very frequently I get data in Comma Separated Value (CSV) format, and reliably importing/converting it can be a pain.

Here’s our sample CSV file, library_test.csv:

"Easting","Northing","Library"
625539.6,4837170.9,"Dufferin St. Clair"
625862.0,4838241.1,"Oakwood Village"
626251.0,4835287.2,"Bloor Gladstone"
626671.7,4836922.6,"Davenport"
627227.2,4840006.4,"Forest Hill"

ogr has a CSV driver. In its documentation the Virtual Format driver is touched upon. This allows you to set up a data definition file, especially useful if you read the same format frequently.

Here’s the VRT file for that CSV:

&amp;amp;lt;OGRVRTDataSource&amp;amp;gt;
    &amp;amp;lt;!-- note that OGRVRTLayer name must be basename of source file --&amp;amp;gt;
    &amp;amp;lt;OGRVRTLayer name=&amp;amp;quot;library_test&amp;amp;quot;&amp;amp;gt;
        &amp;amp;lt;SrcDataSource&amp;amp;gt;library_test.csv&amp;amp;lt;/SrcDataSource&amp;amp;gt;
        &amp;amp;lt;GeometryType&amp;amp;gt;wkbPoint&amp;amp;lt;/GeometryType&amp;amp;gt;
        &amp;amp;lt;!-- your SRS goes here; I used EPSG SRID --&amp;amp;gt;
        &amp;amp;lt;LayerSRS&amp;amp;gt;EPSG:2958&amp;amp;lt;/LayerSRS&amp;amp;gt;
        &amp;amp;lt;GeometryField encoding=&amp;amp;quot;PointFromColumns&amp;amp;quot; x=&amp;amp;quot;Easting&amp;amp;quot; y=&amp;amp;quot;Northing&amp;amp;quot;/&amp;amp;gt;
   &amp;amp;lt;/OGRVRTLayer&amp;amp;gt;
&amp;amp;lt;/OGRVRTDataSource&amp;amp;gt;

Your CSV file will now behave like a shapefile, or indeed any other geo-format that OGR understands. QGIS is a bit picky – it doesn’t seem to always work out the path of the source file.

To prove these are real coordinates, here’s what I did to make a Google Earth KML file:

ogr2ogr -f KML -t_srs EPSG:4326 library_test.kml library_test.vrt -dsco NameField=Library

Technically, you don’t need to specify the SRS for KML output as it only supports EPSG:4326, but I found you got trivially different results if it was omitted.

Try this in Google Earth: library_test.kml

Categories
GIS

tale of two cities: coordinate reference systems, and what on earth is the maywood tot lot?

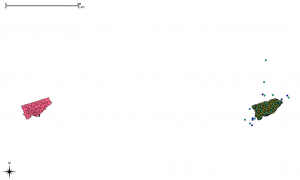
For reasons that are not particularly clear, the Toronto.ca|Open data is in two different coordinate reference systems (CRS), MTM 3 Degree Zone 10, NAD27 (EPSG 2019) and UTM 6 Degree Zone 17N NAD27 (EPSG 26717). This confuses QGIS even if you’ve input the proper SRIDs into SpatiaLite. The image above shows two apparent Torontos, one in each of the CRSs.

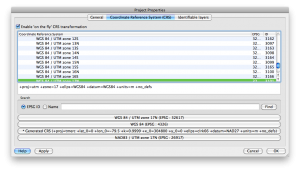
What you have to do is go to to the Project Properties, select the Coordinate Reference System (CRS) tab, and “Enable ‘on the fly’ CRS transformation”. This will line those city layers right back up.

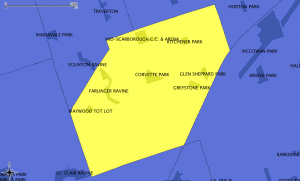
Once we do that, things align as they should. Here’s my neighbourhood, with its parks

But things are still off if you’re querying the SQL directly:


select Distance(Parks.geometry, Neighbourhoods.geometry)/1000
 as Distance_km
 from Parks, Neighbourhoods
 where Parks.name='CORVETTE PARK'
 and Neighbourhoods.hood='Kennedy Park'

which returns a distance of over 314 km. That’s not right.

So we need to transform the geometries to the same CRS.

!!! NB: I might be doing the next bit wrong. CRS transformation is subtle. I’m not, particularly.

The OGR Simple Feature Library is your friend. It can convert pretty much any geo format to another, and can transform coordinates between systems. In exchange for this power, it wants your soul is rather complex.

I’ve chosen to use NAD83(CSRS) / UTM zone 17N (EPSG 2958) for my Toronto maps. It’s fairly accurate over the whole city area. To convert the Parks and Neighbourhoods shape files:

ogr2ogr -s_srs EPSG:2019 -t_srs EPSG:2958 dest/2958/parks/TCL3_UPARK.shp src/2019/parks/TCL3_UPARK.shp
ogr2ogr -s_srs EPSG:26717 -t_srs EPSG:2958 dest/2958/neighbourhoods/Neighbourhoods.shp src/26717/neighbourhoods/Neighbourhoods.shp

Note that it wants the destination file first, then the source. Haven’t seen that order since PIP under CPM/2.2. I was also a bit nerdly, and arranged the files in directories by SRID:

src/2019/address-points
src/2019/business-improvement-areas
src/2019/city-wards
src/2019/parks
src/2019/solid-waste-management-districts
src/2019/toronto-centreline
src/26717/food-banks
src/26717/neighbourhoods
src/26717/places-of-worship
src/26717/priority-invest-neighbourhoods
src/26717/rent-bank-zones
src/26717/rent-banks
src/26717/transit-city
dest/2958/address-points
dest/2958/business-improvement-areas
dest/2958/city-wards
dest/2958/food-banks
dest/2958/neighbourhoods
dest/2958/parks
dest/2958/places-of-worship
dest/2958/priority-invest-neighbourhoods
dest/2958/rent-bank-zones
dest/2958/rent-banks
dest/2958/solid-waste-management-districts
dest/2958/toronto-centreline
dest/2958/transit-city

If we load the transformed shapefiles into Spatialite, and run that query again, it comes out with the correct distance: 0.0 km, as Corvette Park is in the Kennedy Park Neighbourhood.

Now we can run a proper query: what parks are in Kennedy Park, and what are their areas?

select tp.name, round(Area(tp.geometry)/10000,1) as Area_ha
 from Parks as tp, Neighbourhoods as tn
where tn.hood='Kennedy Park'
 and within(tp.geometry, tn.geometry)
order by Area_ha
NAME Area_ha
MAYWOOD TOT LOT 0.7
KITCHENER PARK 0.8
GLEN SHEPPARD PARK 1.0
GREYSTONE PARK 1.1
CORVETTE PARK 2.5
MID-SCARBOROUGH C.C. & ARENA 2.9
FARLINGER RAVINE 2.9

(note how I sneakily used the round() function to avoid too many decimal places?)