Categories
GIS Uncategorized

TAFL — as a proper geodatabase

Update, 2017: TAFL now seems to be completely dead, and Spectrum Management System has replaced it. None of the records appear to be open data, and the search environment seems — if this is actually possible — slower and less feature-filled than in 2013.

Update, 2013-08-13: Looks like most of the summary pages for these data sets have been pulled from data.gc.ca; they’re 404ing. The data, current at the beginning of this month, can still be found at these URLs:

I build wind farms. You knew that, right? One of the things you have to take into account in planning a wind farm is existing radio infrastructure: cell towers, microwave links, the (now-increasingly-rare) terrestrial television reception.

I’ve previously written on how to make the oddly blobby shape files to avoid microwave links.  But finding the locations of radio transmitters in Canada is tricky, despite there being two ways of doing it:

  1. Wrestle with the Spectrum Direct website, which can’t handle the large search radii needed for comprehensive wind farm design. At best, it spits out weird fixed-width text data, which takes some effort to parse.
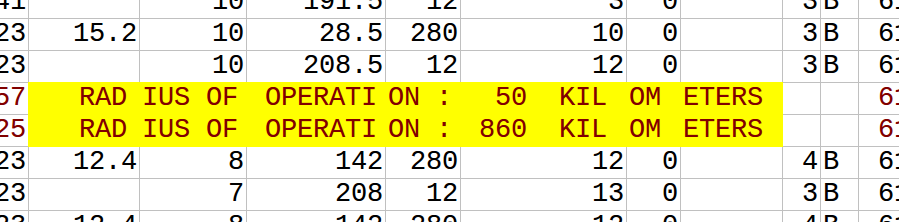
  2. Download the Technical and Administrative Frequency Lists (TAFL; see update above for URLs), and try to parse those (layout, fields). Unless you’re really patient, or have mad OpenRefine skillz, this is going to be unrewarding, as the files occasionally drop format bombs like
    never do this, okay?
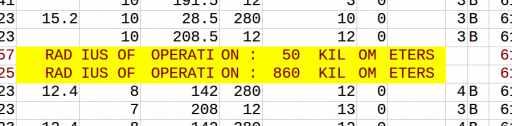
    Yes, you just saw conditional different fixed-width fields in a fixed-width text file. In my best Malcolm Tucker (caution, swearies) voice I exhort you to never do this.

So searching for links is far from obvious, and it’s not like wireless operators do anything conventional like register their links on the title of the properties they cross … so these databases are it, and we must work with them.

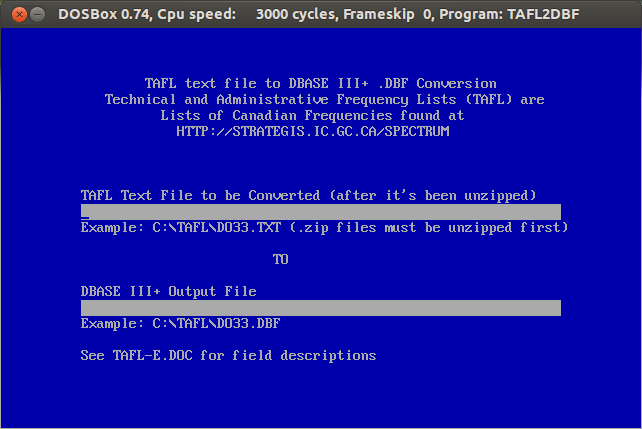
The good things is that TAFL is now Open Data, defined by a reasonable Open Government Licence, and available on the data.gc.ca website. Unfortunately, the official Industry Canada tool to process and query these files, is a little, uh, behind the times:tafl2dbfYes, it’s an MS-DOS exe. It spits out DBase III Files. It won’t run on Windows 7 or 8. It will run on DOSBox, but it’s rather slow, and fails on bigger files.

That’s why I wrote taflmunge. It currently does one thing properly, and another kinda-sorta:

  1. For all TAFL records fed to it, generates a SpatiaLite database containing these points and all their data; certainly all the fields that the old EXE produced. This process seems to work for all the data I’ve fed to it.
  2. Tries to calculate point-to-point links for microwave communications. This it does less well, but I can see where the SQL is going wrong, and will fix it soon.

taflmunge runs anywhere SpatiaLite does. I’ve tested it on Linux and Windows 7. It’s just a SQL script, so no additional glue language required. The database can be queried on anything that supports SQLite, but for real spatial cleverness, needs SpatiaLite loaded. Full instructions are in the taflmunge / README.md.

TAFL is clearly maintained by licensees, as the data can be a bit “vernacular”. Take, for example, a tower near me:

pharm_eg

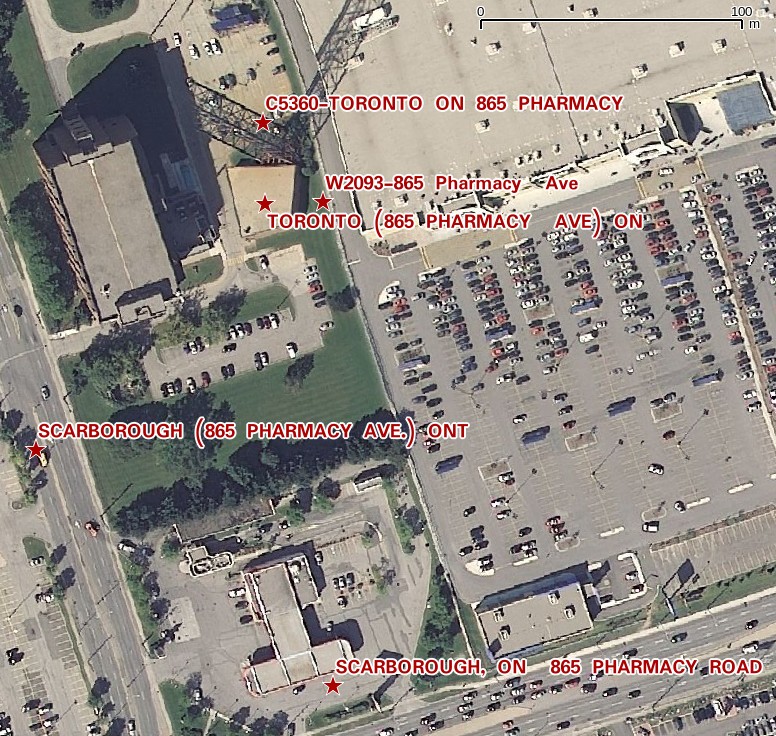
The tower is near the top of the image, but the database entries are spread out by several hundred meters. It’s the best we’ve got to work with.

Ultimately, I’d like to keep this maintained (the Open Data TAFL files are updated monthly), and host it in a nice WebGIS that would allow querying by location, frequency, call sign, operator, … But that’s for later. For now, I’ll stick with refining it locally, and I hope that someone will find it useful.

Categories
GIS

Toronto Data really open

Looks like the data sets at toronto.ca/open might finally actually be open; that is, usable in a way that doesn’t bind subsequent users to impossible terms. The new licence (which unfortunately is behind a squirrelly link) basically just requires you to put a reference to this paragraph somewhere near your data/application/whatever:

Contains public sector Datasets made available under the City of Toronto’s Open Data Licence v2.0.

and a link to the licence, where possible.

Gone are the revocation clauses, which really prevented any open use before, because they would require you to track down all the subsequent users of the data and get them to stop. Good. I think we can now use the data in OpenStreetMap.

While commenting on the licence’s squirrelly URL — I mean, could you remember http://www1.toronto.ca/wps/portal/open_data/open_data_fact_sheet_details?vgnextoid=59986aa8cc819210VgnVCM10000067d60f89RCRD? — I stumbled upon the comedy gold that is the City of Toronto Comments Wall log. There goes my planned reading for the day.

Categories
GIS

a simple geocoder for toronto

I’m going to use SpatiaLite and the Toronto One Address Repository to try some simple geocoding. That is, given an address, spit out the real-world map coordinates. As it happens, the way the Toronto data is structured it doesn’t really need to use any GIS functions, just some SQL queries. There are faster and better ways to code this, but I’m just showing you how to load up data and run simple queries.

SpatiaLite is my definition of magic. It’s an extension to the lovely SQLite database that allows you to work with spatial data – instead of selecting data within tables, you can select within polygons, or intersections with lines, or within a distance of a point.

I’m going to try to avoid having too many maps here, as maps are a snapshot of a particular view of a GIS at a certain time. Maps I can make; GIS is what I’m trying to learn.

So, download the data and load up SpatiaLite GUI. Here I’ve created a new database file. addresses.sqlite. I’m all ready to load the shapefile.

Shapefiles are messy things, and are definitely glaikit. Firstly, they’re a misnomer; a shapefile is really a bunch of files which need to be kept together. They’re also a really old format; the main information store is actually a dBaseIII database. They also have rather dodgy ways of handling projection metadata. For all their shortcomings, no-one’s come up with anything better that people actually use.

Projection information is important, because the world is inconveniently unflat. If you think of a projected X-Y coordinate system as a graph paper Post-It note stuck to a globe, the grid squares depend on where you’ve decided to stick the note. Also, really only the tiny flat part that’s sticking to the globe closely approximates to real-world coordinates.

Thankfully, the EPSG had a handle on all this projection information (and, likely, Post-It notes). Rather than using proprietary metadata files, they have a catalogue of numbers that exactly identify map projections. SpatiaLite uses these Spatial Reference System Identifiers (SRIDs) to keep different projections lined up.

Toronto says its address data is in ‘MTM 3 Degree Zone 10, NAD27’. That’s not a SRID. You can list all the SRIDs that SpatiaLite knows with:

select * from spatial_ref_sys

which returns over 3500 results.

As we know there’s an MTM (Modified Transverse Mercator) and a 27 in the title, we can narrow things down:

select srid,ref_sys_name from spatial_ref_sys where ref_sys_name like '%MTM%' and ref_sys_name like '%27%'

The results are a bit more manageable:

srid ref_sys_name
2017 NAD27(76) / MTM zone 8
2018 NAD27(76) / MTM zone 9
2019 NAD27(76) / MTM zone 10
2020 NAD27(76) / MTM zone 11
2021 NAD27(76) / MTM zone 12
2022 NAD27(76) / MTM zone 13
2023 NAD27(76) / MTM zone 14
2024 NAD27(76) / MTM zone 15
2025 NAD27(76) / MTM zone 16
2026 NAD27(76) / MTM zone 17
32081 NAD27 / MTM zone 1
32082 NAD27 / MTM zone 2
32083 NAD27 / MTM zone 3
32084 NAD27 / MTM zone 4
32085 NAD27 / MTM zone 5
32086 NAD27 / MTM zone 6

So it looks like 2019 is our SRID. That last link goes to spatialreference.org, who maintain a handy guide to projections and SRIDs. (Incidentally, Open Toronto seems to use two different projections for its data – the other is ‘UTM 6 Degree Zone 17N NAD27’ with a SRID of 26717.)

So let’s load it:

This might take a while, as there are over 500,000 points in this data set.

If you want to use this data along with more complex geographic queries, add a Spatial Index by right-clicking on the Geometry table and ‘Build Spatial Index’. This will take a while again, and make the database file quite huge (128MB on my machine).

Update: there’s a much quicker way of doing this without messing with invproj in this comment.

Now we’re ready to geocode. I was at the Toronto Reference Library today, which is at 789 Yonge Street. Let’s find that location:

select easting, northing, address, lf_name, name, fcode_desc from TCL3_ADDRESS_POINT where lf_name like 'yonge%' and address=789

which gives:

EASTING NORTHING ADDRESS LF_NAME NAME FCODE_DESC
313923.031 4836665.602 789 YONGE ST Toronto Reference Library

(for most places, NAME and FCODE_DESC are blank.)

Ooooh … but those coordinates don’t look anything like the degrees we had yesterday. We have to convert back to unprojected decimal degrees with my old friend, proj. If we store the northing, easting and a label in a file, we can get the get the geographic coordinates with:

invproj -E -r -f "%.6f" +proj=tmerc +lat_0=0 +lon_0=-79.5 +k=0.9999 +x_0=304800 +y_0=0 +ellps=clrk66 +units=m +no_defs < file.txt

which gives us:

4836665.602000	313923.031000	-79.386869	43.671824	Library

Now that’s more like it:  43.671824°N, 79.386869°W. On a map, that’s:

Pretty close, eh?

Incidentally, I didn’t just magic up that weird invproj line. Most spatial databases use proj to convert between projections, and carry an extra column with the command line parameters. For our SRID of 2019, we can call it up with this:

select proj4text from spatial_ref_sys where srid=2019;

which returns:

+proj=tmerc +lat_0=0 +lon_0=-79.5 +k=0.9999 +x_0=304800 +y_0=0 +ellps=clrk66 +units=m +no_defs

Update: there’s a much better way of invoking invproj. It understands EPSG SRIDs, so we could have done:

invproj -E -r -f "%.6f" +init=EPSG:2019 < file.txt