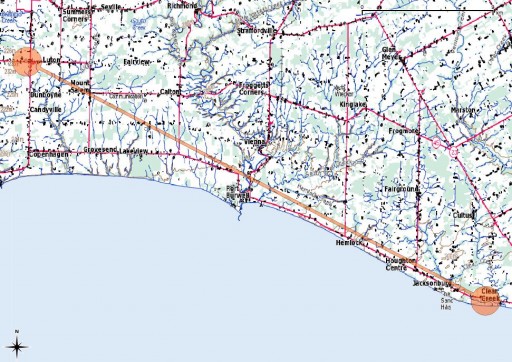
Let’s say you operate microwave radio links, and you want to see if you could build a link between, say, the huge comms tower at Clear Creek, ON and your tower just south of Aylmer. You know that Erie Shores Wind Farm is in the middle of the route. Do the 77m diameter turbines attenuate your signal to nothing?
This is a real issue I have to deal with every day, except in reverse: when I’m planning wind farms, I don’t want to be blocking existing licensed links. I use Spectrum Direct to find these links (and precisely two years ago, I showed you how to write Spectrum Direct data as CSV), but up until now I worked out affected zones (called “consultation zones”) by hand.
The Radio Advisory Board of Canada and the Canadian Wind Energy Association developed a joint protocol on sizing consultation zone for wind turbines, documented in the RABC CANWEA Guidelines. The one for a microwave link comprises:
- A 1km buffer around the start and end points of the link;
- A distance-, frequency- and wind-turbine diameter-specific path width between the points.
Here I’m only going to consider the 2D geometry of the path. Lots of people in the radio industry get paid money to do line-of-sight terrain analysis, and I’m ignoring this for now. All I’m doing here is using Python’s Shapely library to make the dumb-bell shaped buffer around the path and endpoints. I learned of Shapely from Erik Westra’s book Python Geospatial Development. Here’s some code that outputs pipe-separated well-known text that imports nicely into QGIS:
#!/usr/bin/python
# -*- coding: utf-8 -*-
# Calculate RABC/CanWEA Microwave Link Consultation Zone
# scruss - 2012-10-29

import pyproj
import shapely.geometry
from shapely.wkt import dumps

# hard-coded details (sorry)
startlat = 42.582892  # Clear Creek
startlong = -80.603875
endlat = 42.731776  # South Aylmer
endlong = -80.98768
frequency = 6e9  # 6 GHz
rotor = 77.0  # wtg rotor diameter, m

# calculate distance between points
g = pyproj.Geod(ellps='WGS84')
(az12, az21, dist) = g.inv(startlong, startlat, endlong, endlat)

# Width of microwave link fresnel zone
Lc = rotor + 52 * ((dist / 1000) / (frequency / 1e9)) ** 0.5

# calculate line string along path with segments <= 1 km
lonlats = g.npts(startlong, startlat, endlong, endlat,
                 1 + int(dist / 1000))

# npts doesn't include start/end points, so prepend/append them
lonlats.insert(0, (startlong, startlat))
lonlats.append((endlong, endlat))

# translate line string into projected coordinates
utms = []
srcp = pyproj.Proj(init='epsg:4326')  # WGS84
destp = pyproj.Proj(init='epsg:32617')  # WGS84 UTM Zone 17N
for (lon, lat) in lonlats:
    (utmx, utmy) = pyproj.transform(srcp, destp, lon, lat)
    utms.append((utmx, utmy))

# turn start and end points into Shapely point objects
startpt = shapely.geometry.Point(utms[0])
endpt = shapely.geometry.Point(utms[-1])

# draw a 1km buffer around start/end points
startb = startpt.buffer(1000)
endb = endpt.buffer(1000)

# convert microwave path to a Shapely LineString
path = shapely.geometry.LineString(utms)
pathb = path.buffer(Lc / 2) # buffer it to fresnel zone width

# join the buffers into one shape
zone = startb.union(pathb).union(endb)

# output the shape as well known text
print 'id|wkt'
print '|'.join(('1', dumps(zone)))
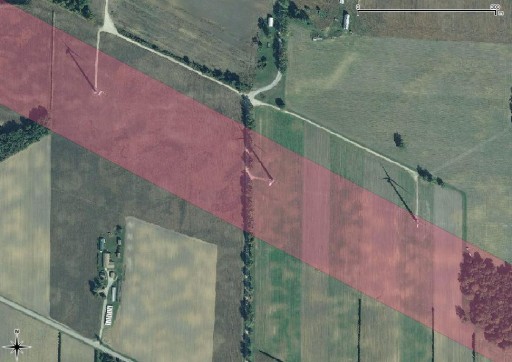
That little snippet creates the buffer in projected coordinates from two geographic coordinates as inputs. Grabbing the Erie Shores coordinates from OpenStreetMap and the USGS WMS, let’s see if the beam will pass:
Uh, no. That’s three turbines in the path in that little section alone. Back to the drawing board.


3 replies on “Making weird composite shapes with Shapely”
[…] previously written on how to make the oddly blobby shape files to avoid microwave links. But finding the locations of radio transmitters in Canada is tricky, despite there being two […]
[…] used Shapely before for more sensible things, but it’s a dab hand at driving anything Cartesian — like my old […]
[…] One of the many constraints in building wind farms is allowing for radio links. Both the radio and the wind industries have agreed on a process of buffering and consultation. Here’s how I handled it in Python: Making weird composite shapes with Shapely. […]