Quantum GIS (QGIS) has a very powerful image georeferencing module. What that allows you to do is convert screen pixels to a map of an area. The pixels could be from a scanned map or from a screen image. Scanned maps can sometimes be a little distorted, but QGIS’s georeferencer can handle that, within limits.
For an example, say I live in Redickville, ON (I don’t, but some folks do). I’ve heard from North Dufferin Agricultural & Community Taskforce (NDACT) that a large quarry is planned in my area. How close am I going to be from it?
NDACT has a helpful map (2.4 MB PNG image) had a helpful map (which I’ve kept here so you can work through this: MelancthonAerial), but it has no scale. It’s clearly derived from something like Google Maps, so it’s not exactly a free image I can throw about. One thing about georeferencing is that both the source image and the map from which you take you control points affect the licensing of the final map. You’re ending up with a derived work.
There are lots of sources of coordinates for your control points. You could always use Google Maps, but then you’re well down the derived work sinkhole. GeoGratis has a bunch of good data sources, and they are free to use. I’m going to use Toporama‘s digital image maps, as they’re clear and fairly accurate.
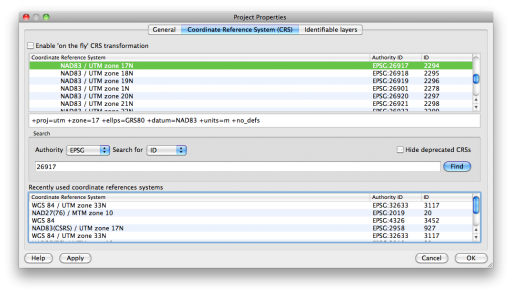
Redickville is on Toporama sheet 041A01. I’ve downloaded it as UTM, as it’s easier to measure distances that way. You want to set up your project so it uses the coordinate reference system (CRS) that the control point map uses. Toporama uses EPSG 26917 in the area (easily checked with gdalinfo; it’ll come up with something like AUTHORITY[“EPSG”,”26917″]]), so you should set the project to use that CRS:
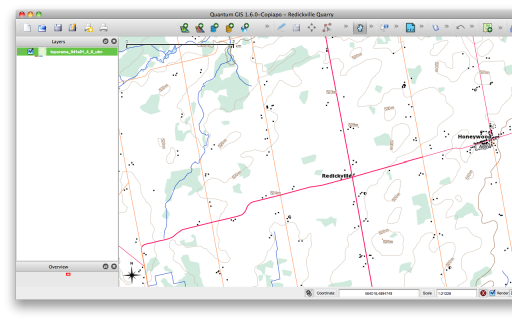
 And here’s the raster map loaded into QGIS;
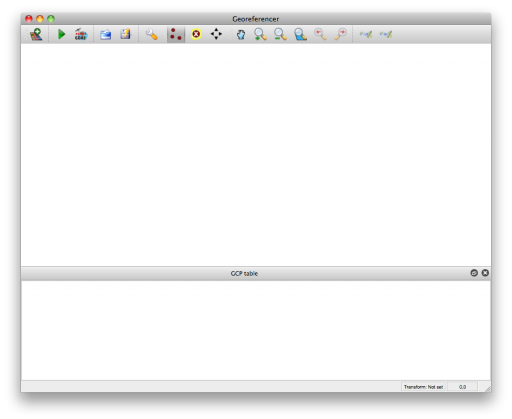
 Opening up the georeferencer plugin (which is now in the Raster menu, as of QGIS 1.8) gives you a whole lot of blank:
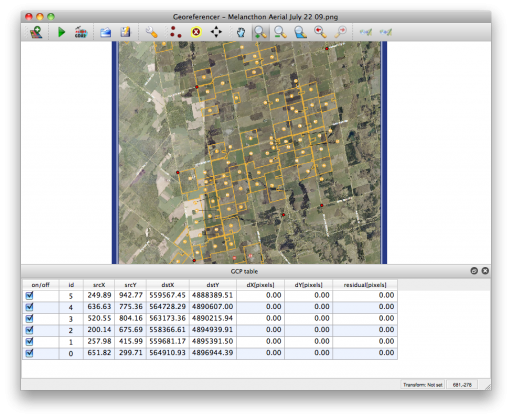
 If we open the raster, you can zoom into the area into which you want to put control points. You want to have the highest zoom that the map’s still clear, as the accuracy of your final map depends on how well you placed control points. I’ve chosen road intersections as my control points. Here are the ones I’m going to use:
Point   E-W Road        N-S Road        Note
1       County Rd 21    2nd Line W      Honeywood
2       County Rd 21    4th Line
3       20th Side Rd    5th Line
4       15th Side Rd    County Rd 124   just S of where 124 straightens
5       15th Side Rd    Mulmur Townline
6       4th Line        5th Line        4th Line really runs SE-NW
These intersections are fairly well spaced apart, and are clear on both maps. So I choose a pixel on the map in the georeferencer, and a dialogue comes up:
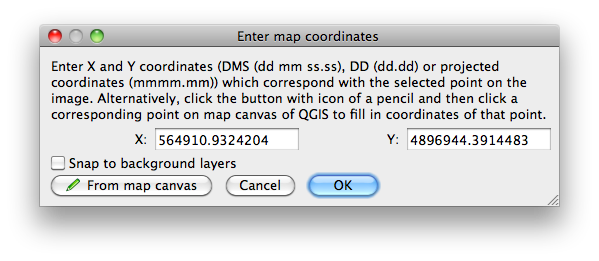
(If you’ve downloaded the MelancthonAerial archive from here, the georeferencing points should load automatically from the “Melancthon Aerial July 22 09.png.points” file. If you want to go through the exercise of manually adding reference points, delete the points file.)
Here I’ve already clicked on the corresponding point on the Toporama map, and the coordinates have been filled in. If you know the coordinates, you can enter them in the boxes. Once you click OK, you have your first control point:
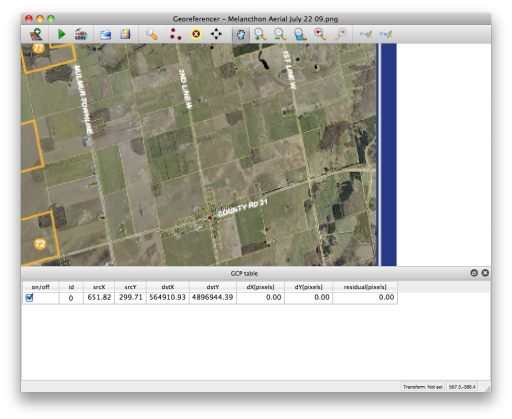 We can add the rest one by one. QGIS’s “Zoom Previous” is really useful for flipping between scales on both the plugin window and the main map. It’s probably a good idea to “Save GCP Points As …” every now and again so you don’t lose your work. Here are all of the points in the georeferencer plugin:
 Now you want to modify the Transformation Settings; it’s the little wrench/spanner in the toolbar:
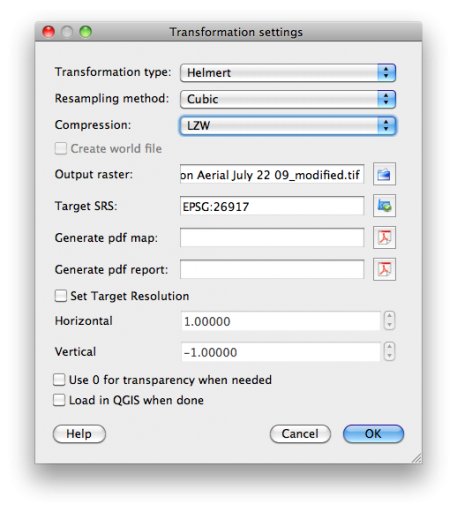
There are lots of options here:
- Transformation Type: Linear is useful if you’re just adding georeference data to an already computer generated map. Helmert is a simple shear/scale/rotate transformation. The various Polynomial types will correct more gross distortions, but need many control points and can be processor intensive. Thin Plate Spline will distort your map locally to match GCPs; this can work well if your map’s a bit “vernacular”, but if your control points are wrong, your map will end up hilariously melty.
- Resampling Method: This controls how the output pixels are calculated. Nearest Neighbour is quick and blocky, but useful if you’re mapping an image that has sharp transitions. Cubic maintains more detail, while applying some smoothing at the cost of some detail loss and a fair bit of processing power. The other options can look nice, but eat CPU. This is worth experimenting with many options, as there’s no one solution for all maps.
- Compression: This controls the file size of the output GeoTiff file. JPEG and Deflate can result in small files, but there’s a chance that other GIS systems can’t read the data. Note that JPEG is lossy, and will lose some detail.
Don’t forget to set the output raster file, and make sure that the target SRS matches the CRS (EPSG 26917) you chose earlier.
Helmert is a useful transformation type to check your work. The plugin plots the residual difference between the two sets of map control points as red lines. Here, I’ve clearly made an error in point ID 2:
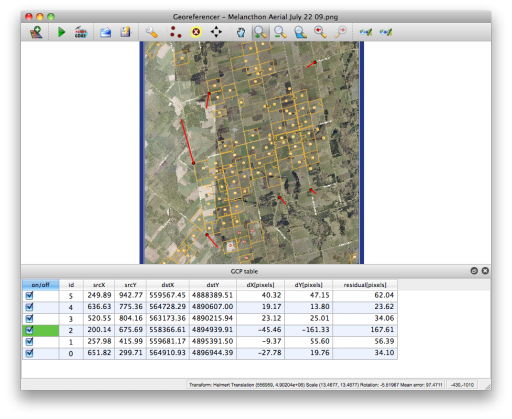 If you unselect the bad point, the plugin quickly calculates the residuals again. When this one bad point is removed, the residuals drop down to less than 1.0 for each point. I’ve got enough points for a Helmert transformation with 5 GCPs, but I’d probably want some more points for more complex transformations.
Once you hit “Start Transformation”, QGIS will create your referenced image. If you’ve chosen a simple linear transformation, it won’t create a GeoTiff file, but just a world file for your image.
So here’s the georeferenced image overlaid on the Toporama map, with a bit of transparency. It’s quite a good match:
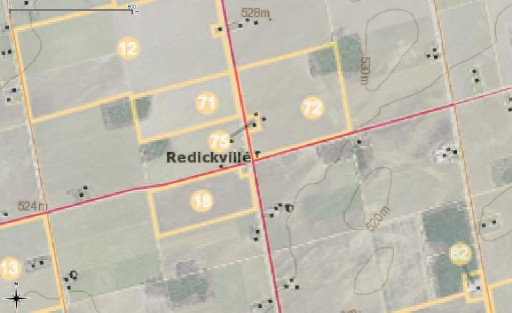
(the above’s an image saved straight from QGIS. It helpfully creates a world file too, so here it is: redickville.jpgw)
So to answer the hypothetical question, Redickville’s pretty well surrounded by this proposed quarry.


