When designing wind farms, you need to keep the turbines a certain distance apart from one another. If you don’t, the wakes from the turbines reduce efficiency, and the turbulence can reduce the warranted life of the machine. Typically, a manufacturer might specify a minimum downwind separation of 5 diameters, and a crosswind separation of 3 diameters. It’s an easy check with a buffer overlap, but these buffers are elliptical, which not all GIS packages can draw.
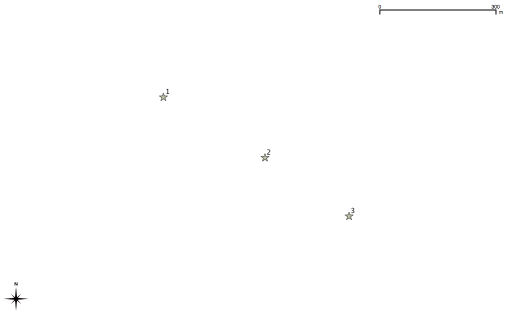
Take, for example, the following three points designated as (completely made-up) wind turbine locations:
name    XCOORD           YCOORD
1    557186.675000    4757125.590000
2    557447.931000    4756968.690000
3    557664.999000    4756817.810000
These look quite far apart, even if you were using large, 100+m diameter wind turbines:
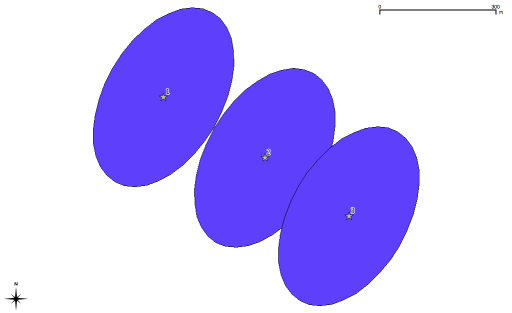
 But if we have a wind direction of 210°, downwind/crosswind separation of 5D & 3D respectively, and a 101m diameter rotor, it’s not so good:
 Turbines 2 & 3 are too close together; the ellipses shouldn’t touch.
As awk is the only scripting language I have on my work computer, I wrote the script that generates the buffer shapefile in awk. The script calls Frank’s Shapefile C Library utilities to actually make the shapefile. Here’s the code:
#!/bin/awk -f
# draw an ellipse based on turbine location to generate
#  for WTG separation buffer
# scruss - 2011-09-27

# assumes that stdin has three columns:
#  1 - label
#  2 - x coordinate
#  3 - y coordinate

# variables:
#  diameter = rotor diameter
#  cross = crosswind separation, diameters
#  down = downwind separation, diameters
#  wind = prevailing wind direction
#  base = base for shape file name

BEGIN {
	OFMT="%.1f";
	CONVFMT="%.1f";
	OFS=" ";

	if (diameter < 0) {
		print "diameter must be set";
		exit;
	}

	if (cross < 0) {
		print "cross must be set";
		exit;
	}

	if (down < 0) {
		print "down must be set";
		exit;
	}

	if (down < cross) {
		print "down must be greater than cross";
		exit;
	}

	if (wind < 0) {
		print "wind must be set";
		exit;
	}

	if (base ~ /^$/) {
		print "base must be a string";
		exit;
	}

	pi = 3.141592654; # I know, I know ...
	# calc cartesian angle from wind bearing, in radians
	beta = ((450 - wind)%360) * pi/180;

	# output shapelib tools init commands
	print "dbfcreate " base " -s name 40";
	print "shpcreate " base " polygon";
}

# for every line
{
	name=$1;
	x=$2;
	y=$3;

	major = diameter * down/2;
	minor = diameter * cross/2;
	first="";
	points="";
	maxn=36;
	for (i=0; i<maxn; i++) {
	    alpha = (i * (360/maxn)) * pi/180;
	    x1 = x + major * cos(alpha) * cos(beta) - minor * sin(alpha) * sin(beta);
	    y1 = y +  major * cos(alpha) * sin(beta) + minor * sin(alpha) * cos(beta);
	    if (i == 0) { # store the first point
		first= x1 " " y1;
	    }
	    points = points  " " x1 " " y1;
	}
	points = points  " " first;
	print "dbfadd " base ".dbf " name;
	print "shpadd " base, points;
}
awk is charmingly odd in that you can specify variable on the command line. Here’s how I called it, with the above coordinates as input:
awk -v diameter=101 -v cross=3 -v down=5 -v wind=210 -v base="fakewtg-ellipse" -f separation.awk
Pipe the output through a shell, and there are your ellipses.
Leave a Reply