(Hey! I’m not a lawyer. Read a few paragraphs of this, and it’ll be clear I shouldn’t even try to give any kind of opinion. The screenshots I include with maps.me, booking.com and Google data are presented merely for review and critique of the situation.)
An interesting discussion showed up on the OSM Legal mailing list a couple of weeks back: MAPS.ME combining OSM data and non-OSM data? OSM has some restrictions on how its data can be used. At a grossly simple level, if you mix your proprietary data in with OSM data and present a single layer map, you must either:
- provide the proprietary data you mixed in under the same licence as OSM, or;
- stop doing that.
The OSMF Licence/Community Guidelines/Horizontal Map Layers – Guideline has some example scenarios that I will quote here:
Examples of where you DO NOT need to share your non-OpenStreetMap data
- …
- You use OpenStreetMap as a base topographical map and make your best reasonable efforts to exclude ALL restaurants. You then add a layer of your own restaurant data.
Examples of where you DO need to share your non-OpenStreetMap data
- …
- You add restaurants in one area from non-OpenStreetMap data based on comparison with OpenStreetMap data in other layers.
So for this article, please bear in mind that where the above example says restaurants, I’m looking for an analogous case with hotels.
MAPS.ME (which they want you to pronounce as “maps with me”, even though it says “maps dot me”; I guess “maps ∘ me” wouldn’t make such a nice URI) is an offline map app that shows a mix of POIs over a custom-styled OSM basemap. Its publisher mixes OSM POIs with proprietary ones, and publishes a list (local copy: skipped_nodes-20160731.zip) of OSM nodes that it has skipped from its POI list. To satisfy my curiosity, I wanted to see if the required separation of data was in place with maps.me.
First, I used overpass turbo to return all the hotel and motel nodes in and around Toronto (the query I used was “type:node and (tourism=hotel or tourism=motel) in bbox”, saved as TorontoHotelNodes.zip). This list contains 50 hotels and motels.
Next, I used maps.me’s skipped nodes list to find the OSM hotels and motels that maps.me had omitted from their app. This list should closely match the one from booking.com, where the app company said they got their hotel data. For completeness, I queried the OSM hotels extract to see what hotels maps.me had possibly not skipped.
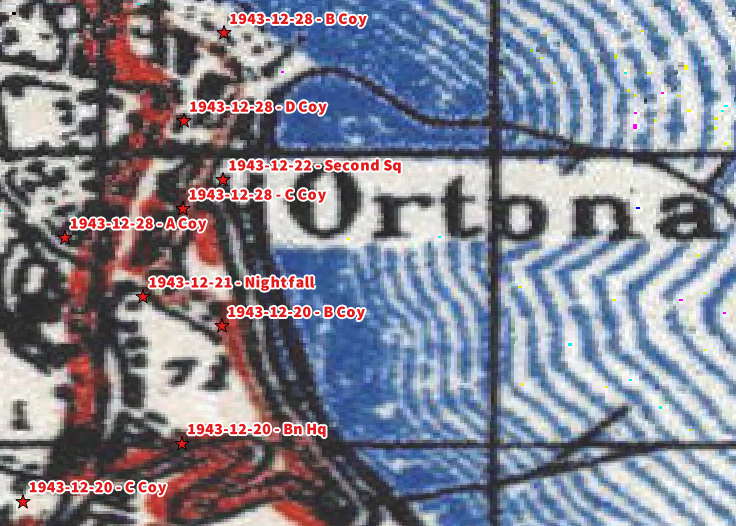
Finally, I overlaid those OSM nodes on a georeferenced screendump from booking.com’s Google map. Here’s what it looks like (click to enlarge):
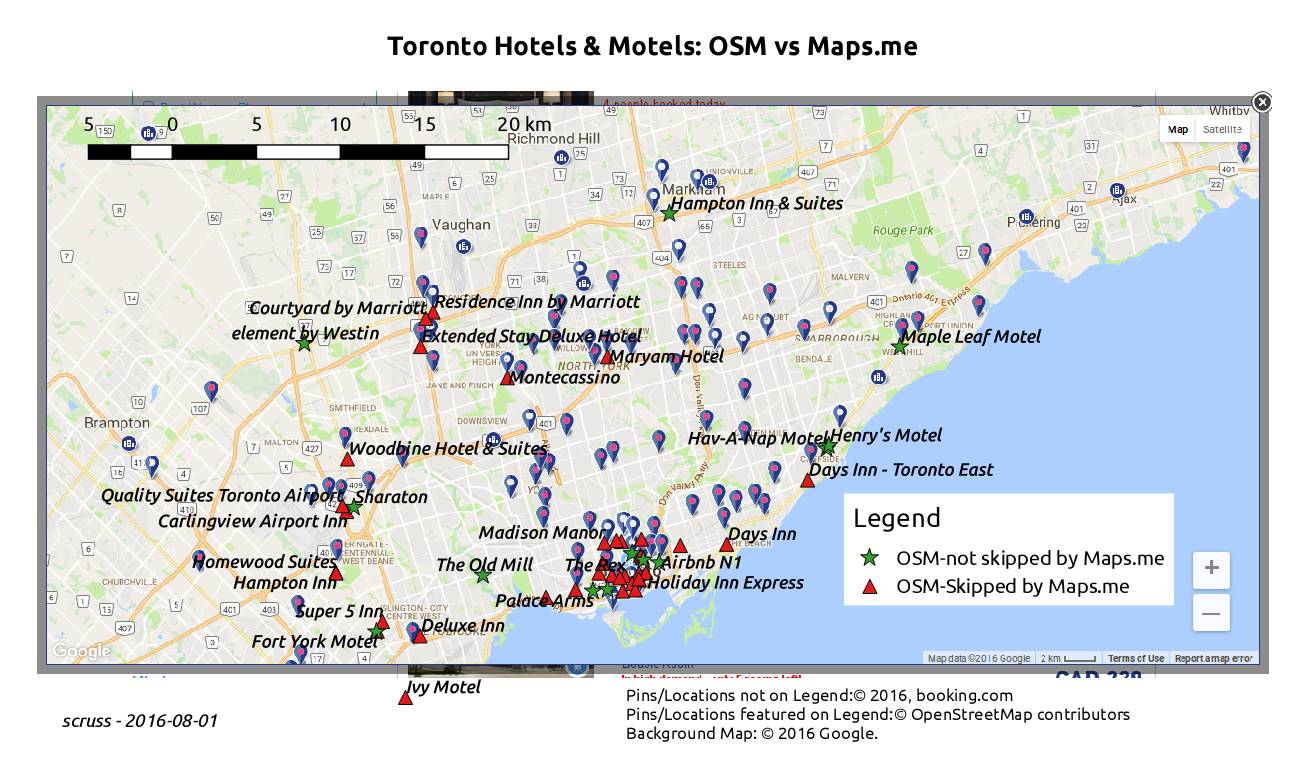
So OSM nodes not skipped (which is not necessarily the same as used) by maps.me are marked ★, while those excluded by maps.me are marked ⯅. At first glance, there’s clearly not a 100% correlation between booking.com hotels, but a few clues emerge that hint strongly that maps.me are mixing in some OSM nodes with some proprietary nodes. It’s therefore likely that maps.me has not abided by the OSMF community guideline.
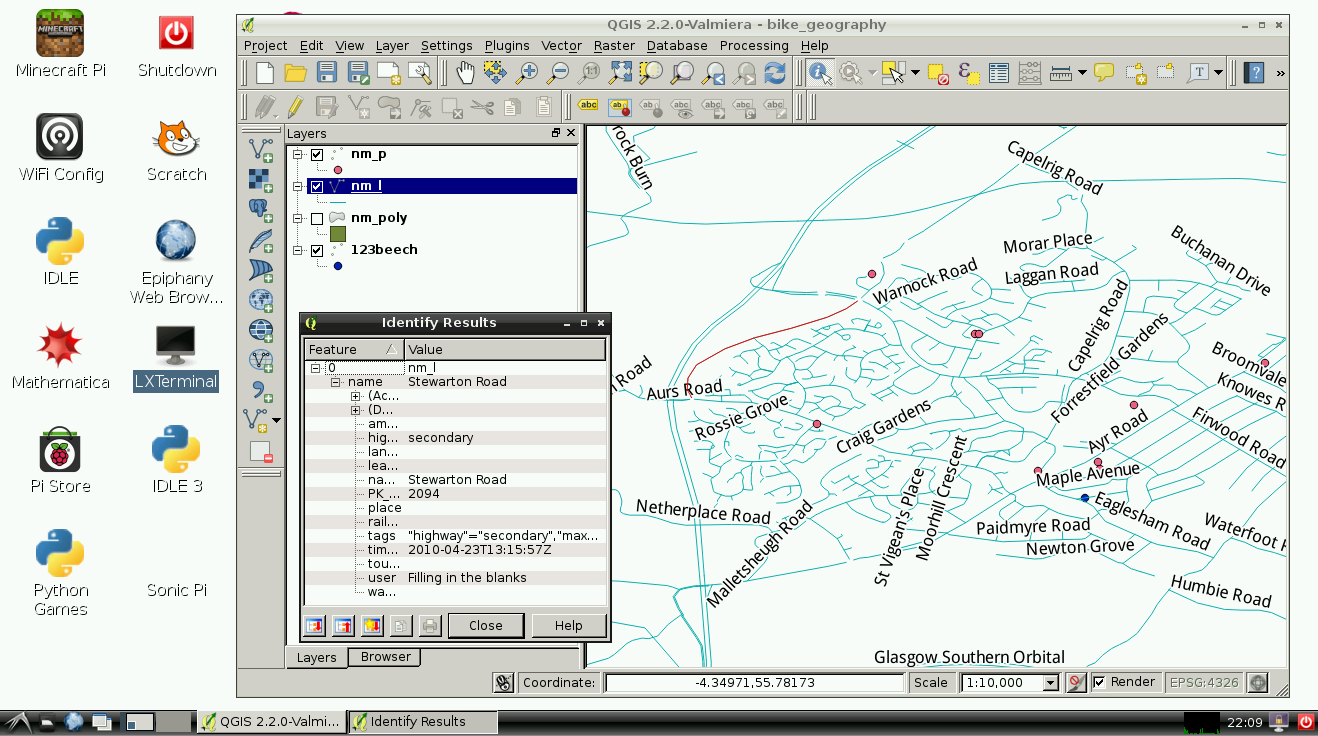
Scrolling around and zooming in on the booking.com hotel map shows that they don’t show you all of the listed properties. There’s always some filter based on location, price or availability. This makes sense if you’re managing a valuable proprietary data set, as there will always be someone trying to scrape your data and take your business with slightly cheaper referrals. One example of a hotel available on booking.com is The Old Mill (booking.com link: Old Mill Toronto) even though it’s not shown with a booking.com pin on my screenshot above. The Old Mill is also shown as not skipped on maps.me, so let’s take a look at it in the app:
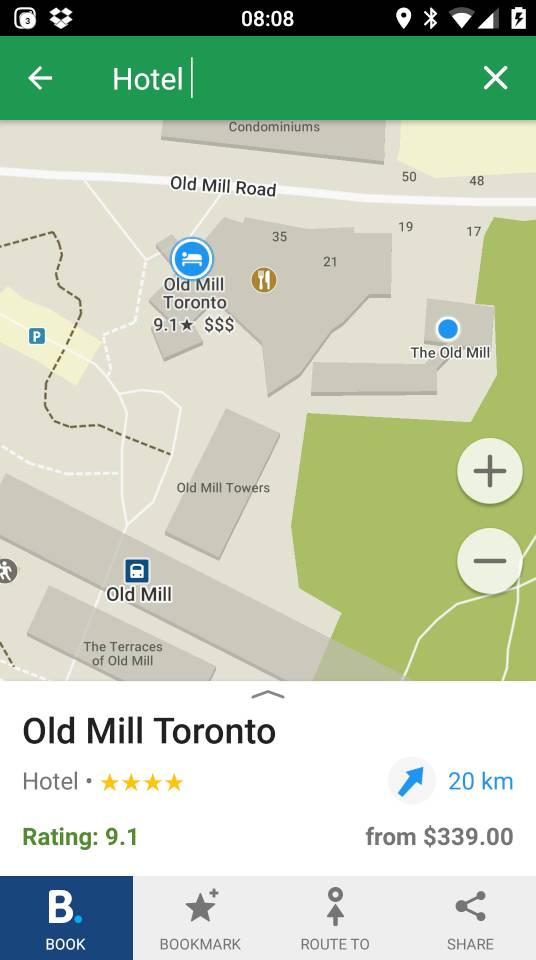 Ah; there’s the booking.com property, with the OSM node off to the east under a slightly different name, and the OSM restaurant node somewhere in between. (When you search maps.me for restaurants, in Toronto at least, there are no referral links: missed opportunity there, folks!)
Since OSM is community-generated data, sometimes our spelling isn’t so great. One hotel node that leaps out from the maps.me node set is the (now fixed) “Sharaton”:
 aka Sheraton Toronto Airport Hotel to booking.com, or Sheraton Toronto Airport Hotel & Conference Centre to its friends:
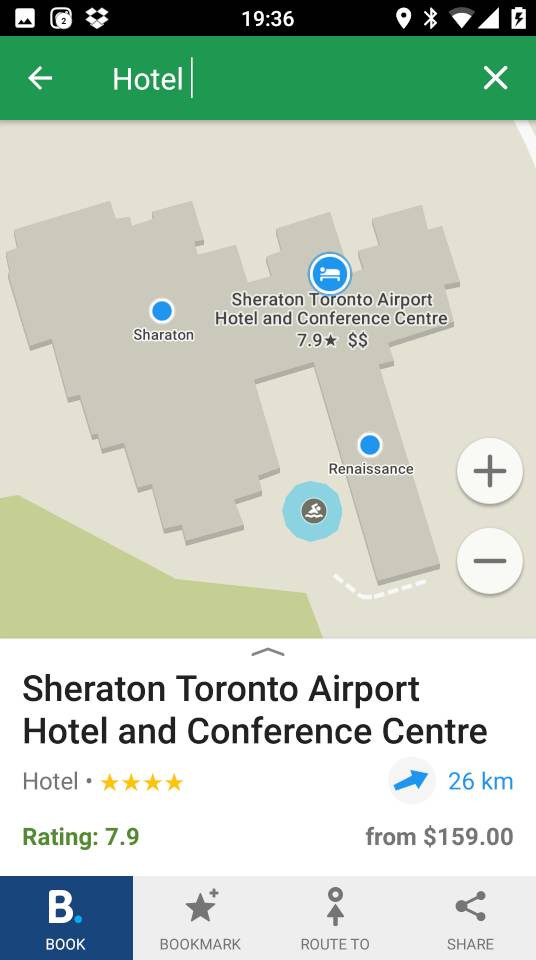 I wonder if maps.me will exclude the OSM node for this Sheraton from now on? Now that its name has been edited, if they do skip it, it means that they’re comparing OSM against a proprietary list, so would be breaking the guidelines. On the other hand, if they don’t exclude it, they really need to get a better fuzzy match algorithm, and post haste.
We can’t know the algorithm that maps.me uses to choose hotels to include referral links and skip the OSM data. The details of that are their trade secret, and no open licence can compel them to disclose it. But the cynic in me has found a possible clue in the budget motels that line Kingston Road on the eastern Toronto lake shore. Both the Days Inn – Toronto East and the Park Motel are listed on booking.com. Only the slightly more expensive Days Inn gets a referral link on maps.me. Could it be that the value of the cheaper motel’s referral isn’t worth including? (Update: this is wrong; I found another reason, which I will write about later.)
In addition, I wonder if maps.me’s skipped nodes list could be considered a “derived work” of booking.com? As the choice of nodes to skip is informed by booking.com’s data, it does give us a small insight into their database.


