Categories
GIS

making of the Canada Day post

Making the My Neighbourhood, Canada Day 2010 post took a bit of planning.

Hardware

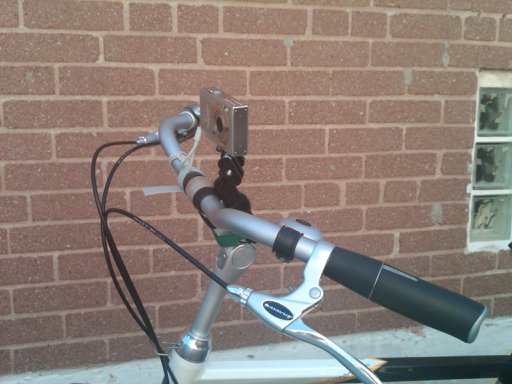
I attached an Ultrapod to the stem of my bike, and added another velcro wrap for security. The GPSMAP 60CSx fitted quite nicely under the bungees on the rear rack. The Ultrapod didn’t quite have enough stability to stay in place without drooping sometimes. I bought (but haven’t tried) the KODAK Adventure Mount, which might be more stable.

The Camera

… is a fairly basic Canon PowerShot SD790IS. What’s important is that it can run CHDK. I’d set it to take a 6MP picture approximately every 20s using the Ultra Intervalometer script.

Synching the camera to the GPS for geotagging

At the end of the trip, I took a picture of my GPS clock screen:


and then compared the time to the camera’s timestamp using jhead:

$ jhead IMG_0316.JPG
 ...
Date/Time    : 2010:07:01 16:59:50

So if the GPS time is 16:58:55, we need to subtract 55s from the camera time to make them match:

$ jhead -ta-0:00:55 IMG*JPG

And let’s check the result:

$ jhead IMG_0316.JPG
 ...
Date/Time    : 2010:07:01 16:58:55

Perfect.

Geotagging the pictures

I used ExifTool. You could also use Prune if you prefer something more graphical. Exiftool does this with minimal fuss:

$ exiftool -geotag canadaday2010-0.gpx IMG_0*JPG

(I realize I could have used exiftool instead of jhead for the timestamp check, but I’ve been using jhead for about a decade, so I know it well and like its compact output.)

You probably want to make use of a WordPress plugin like Add From Server to speed the upload process.

Adding the OpenStreetMap map

The www.Fotomobil.at » wordpress openstreetmap plugin is very flexible, but rather complex to work with. Here I’m calling the map with both markers (and lots of them) and a GPX trace:

[ osm_map lat="43.729" long="-79.275" zoom="14" width="640" height="480" marker_file="https://glaikit.org/wp-content/uploads/2010/07/canadaday2010marker.txt" gpx_file="https://glaikit.org/wp-content/uploads/2010/07/canadaday2010.gpx" ]

(Note that in the example, in order to stop WordPress from interpreting the shortcode, I’ve had to introduce a space after the [ and before the ]; in real life, they’re not there.)

The gpx file is just plain vanilla (canadaday2010.gpx) but the marker file (canadaday2010marker.txt) is a bit special. I must admit to have slightly misused the format, as I discovered that the fourth column, the description, is free-form HTML. As the default is to popup a small image thumbnail, I wedged in code to link to the full-sized image when the thumbnail was clicked. This required me to work out what attachment ID WordPress thought each picture would be. If you’re careful to upload sequentially to a single-user blog installation, you should be okay hitting the right links.

Each line of the marker file was made with a (loooong) shell one liner, an unholy mess of backticks and awk. I’m glad I can’t find it. It really wasn’t pretty at all.
Categories
Uncategorized

fallout from last night’s OSM 6th birthday Mappy Hour in Toronto

It was fun – there were geo-aware cupcakes!

In a moment of geek worlds colliding, Emma showed up, and now I have people clamouring for tablet at Mappy Hour. Sigh, those old ecommons links just don’t fade …

Categories
GIS

toronto data updated

Hey, they’ve updated most of the data sets on toronto.ca | Open!

Categories
Uncategorized

My Neighbourhood, Canada Day 2010

I went for a bike ride on Canada Day. Click on a bicycle icon to see what I saw.

Categories
GIS

The highest point in Toronto

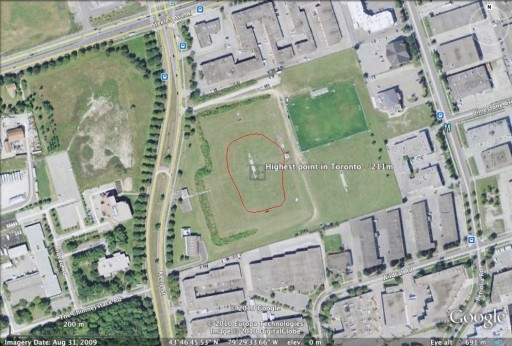
The highest point in Toronto has an elevation of 211m, and appears to be in the middle of one of York University‘s playing fields, just southwest of Keele & Steeles W:

The red blob is the 211m contour, and the centre point is at 43.779325°N, 79.492655°W. The contour was derived from the MNR DEM data for the province.

The city says the highest point is 209 m (at intersection of Steeles Ave West and Keele St), which is pretty close in all three axes.

Categories
GIS

Toronto’s Human Centre, part 2: by neighbourhood

Beware throwaway comments; that way overanalysis lies. This was a challenge.

Taking the 2006 neighbourhoods population into account, the human centre of Toronto is at 43.717955°N, 79.389828°W …

… pretty close to the one I’ve already worked out by ward.

Scraping the neighbourhood populations was hard. For the 140 neighbourhoods, the data is stored in a pdf with the URL like http://www.toronto.ca/demographics/cns_profiles/2006/pdf1/cpa124.pdf (in this case, 124; Kennedy Park, represent!). The population number is stored in a table on page 2 of each pdf. I used pdf2xml to convert the files into something parseable.

Of course, the tables weren’t exactly in the same place in every file, so I took a sample of 10% of the files, and worked out the X & Y coordinates of the population box. pdf2xml spits out elements like

<TOKEN sid="p2_s427" id="p2_w417" font-name="arialmt" serif="yes" fixed-width="yes" bold="no" italic="no" font-size="7.47183" font-color="#000000" rotation="0" angle="0" x="299.739" y="122.117" base="129.634" width="22.7692" height="9.94501">17,050</TOKEN>

Yes, I should have used an XML parser, but a Small Matter of Perl got me 126 out of the 140 matching. The rest I keyed in by hand …

Table after the jump.

Categories
GIS

toronto’s human centre

Since it was trivial to calculate the centre of the city, I thought I’d do something a little more complex: calculate the centre of the city, weighted for population. I scraped the 2006 population data by ward from the City of Toronto: Ward Profiles pages; hooray for curl and regexes. Realising that I had no information on population distribution within wards, I made a good old engineering assumption: we could idealize the population as a point mass at the centroid of each ward, and then calculate the centre of mass by balancing moments around the X and Y axis. (I mean, c’mon – it’s the sort of thing we all think about daily … isn’t it? Guys … hello … anyone there?)

I’ll spare you the details until after the jump, but I calculate the human centre of Toronto to be at 43.717794°N, 79.390299°W – that’s in Blythwood Ravine, just south of Blythwood Road. We should have a picnic there …

Categories
GIS

Toronto’s Angles

As many Canadians will tell you, most Torontonians are a bit skewed. While others might have different explanations, I put it down to our road grid. What we call north in the city is actually some 16.7° west of north.

While we do have a perpendicular grid, it’s twisted to the left (steady, Edmontonians). I attempted to work out what the average angle is.

I eyeballed several long straight streets, and picked out representative intersections. Finidng the coordinates of these intersections took a surprisingly long time, as each street has several road sections. To find an intersection, each section on one road has to be queried against each section of the other. It gets there, eventually.

To save the tedium of showing the queries, here are the results. The angles are anticlockwise from the X-axis.

N-S	 Intersection1 Intersection2 Angle
======== ============= ============= ======
Bathurst King	       Dupont	     16.184
Yonge	 King	       Rosehill	     16.783
Woodbine Queen	       Plains	     17.049

E-W	 Intersection1 Intersection2 Angle
======== ============= ============= ======
Danforth Greenwood     Main	     16.736
Eglinton Dufferin      Bayview	     16.159
Steeles	 Dufferin      Kennedy	     17.194

I was surprised that SpatiaLite didn’t have any angle measurement functions built in, so I had to feed the output through geod. So for instance, for Steeles Avenue, the intersection of Steeles West and Dufferin is at 43.787229°N, 79.470285°W, and the intersection of Steeles East and Kennedy is 43.823636°N, 79.307265°W. Feeding these numbers to geod:

echo '43.787229 -79.470285 43.823636 -79.307265'| geod +ellps=WGS84 -f &quot;%.3f&quot; -p -I +units=m

This spits out three numbers: 72.806    252.918    13727.395. The first is the bearing from the first point to the second; this is the number we’re interested in, and it’s (90-82.806) = 17.194° clockwise from E. The second is the bearing from the second point back to the first. The last is the distance in metres; Steeles is a long, straight street.

Averaging the numbers for the streets I chose gets 16.684°; just the thing for Torontohenge. For a visual axis, maybe using Steeles’s 17.194° could be better, as it’s a line above the city. You can set the map rotation angle in QGIS’s map composer, and get a better aligned city:

Categories
GIS

Finding the exact geographic centre of Toronto

Spacing has alluded to it. The Ontario Science Centre makes bold (and incorrect) claims about it. But here’s the real deal.

  • If you consider Toronto to be defined by its city wards, the centre of Toronto lies at 43.725518°N, 79.390531°W.
  • If you consider Toronto to be defined by its neighbourhoods, the centre of Toronto lies at 43.726495°N, 79.390641°W.

You can work this out in one line of SQL. By combining all the wards or neighbourhoods into one union shape (SpatiaLite uses the GUnion() function), and then calculating the centroid, that’s the centre of the city:

select astext(transform(centroid(gunion(geometry)),4326)) from wards

To get the results in a more human-friendly format, I transformed it to WGS84 (EPSG SRID 4326), and used astext() to get it in something other than binary.

Update, 18 March: great minds, etc … Torontoist just posted the similar In Search of Toronto’s Geographic Centre.

Categories
GIS

oooOOOooh!

Now that’s a bit better. And I did it with only mild shapefile abuse.

You can load the DBF component of a shapefile into Openoffice Calc. Columns get given headers which describe their format. By pasting in the candidates column, adding the right column definition, and then resaving, you get a shapefile with today’s candidates as a new field.